
LCP_hide_placeholder
fomox
MarketsPerpsSpotSwapMemeReferral
More
New User Exclusive $690+
Search Token/Wallet
/

What Drives Cryptocurrency Price Volatility: Support Levels, Resistance Levels, and Bitcoin-Ethereum Correlation Analysis
2025-12-29 04:22
Bitcoin
Crypto Trading
Cryptocurrency market
Ethereum
Macro Trends
Article Rating : 3
106 ratings
# Article Introduction This comprehensive guide explores cryptocurrency price volatility through three critical analytical frameworks: historical market cycles, support-resistance levels, and Bitcoin-Ethereum correlation dynamics. Designed for traders and portfolio managers on Gate, this article explains how price barriers function as trading zones, why Bitcoin and Ethereum move in tandem (0.7-0.9 correlation), and how to leverage multi-year volatility patterns for strategic decision-making. By understanding these interconnected factors, readers can anticipate price movements, manage risk effectively, and optimize trading strategies across volatile cryptocurrency markets. --- **Key Topics Covered:** - Historical volatility patterns and market cycle phases - Support/resistance level identification for trading zones - Bitcoin-Ethereum cross-asset dependencies - Macroeconomic factors influencing price swings
What Drives Cryptocurrency Price Volatility: Support Levels, Resistance Levels, and Bitcoin-Ethereum Correlation Analysis

Examining historical price trends and volatility patterns across multiple market cycles reveals the cyclical nature of cryptocurrency price movements. The cryptocurrency market exhibits distinct phases—accumulation, breakout, profit-taking, and consolidation—that recur with varying intensity and duration. By analyzing multi-year data, traders can identify when the market approaches critical support levels and resistance levels that have historically triggered reversals or continuations.

Market cycles demonstrate that volatility intensifies during specific periods. Recent cryptocurrency market data illustrates this dynamic: NIGHT token experienced a 256% surge from its December 9 low of $0.0337 to its December 21 peak of $0.12008, followed by a 38% pullback to $0.07845 by December 23. This pattern—rapid appreciation followed by significant retracement—mirrors broader market cycle characteristics observed across multiple years.

Understanding these historical patterns enables identification of emerging support and resistance zones. Each cycle tends to establish new price discovery ranges while respecting previously-formed structural levels. When examining longer timeframes, traders observe that resistance levels from earlier cycles often transform into support during subsequent market phases, creating recognizable patterns.

The correlation between price volatility and cycle positioning provides valuable context for anticipating market behavior. Periods of extreme volatility typically concentrate near cycle turning points, while established trends show more directional stability. This relationship between historical volatility patterns and market cycles forms the foundation for technical analysis strategies that incorporate support and resistance level identification, particularly relevant when analyzing how Bitcoin-Ethereum price dynamics influence broader market cycles.

Support and Resistance Levels: Identifying Key Price Barriers and Trading Zones

Support and resistance levels represent critical price barriers that help traders identify optimal trading zones within cryptocurrency markets. Support acts as a price floor where buying pressure typically emerges, preventing further declines, while resistance functions as a ceiling where selling interest intensifies. These price barriers aren't arbitrary; they form through accumulated market psychology and repeated price interactions at specific levels.

When analyzing cryptocurrency price movements, traders use these levels to anticipate where volatility may intensify or stabilize. For instance, looking at recent price trends, a token might find support at previous low points and face resistance at former highs. This cyclical behavior demonstrates how price barriers establish trading zones that constrain price movement within predictable ranges.

Price Barrier Type Market Behavior Trading Zone Application
Support Level Buying pressure increases Buy opportunities emerging
Resistance Level Selling pressure increases Profit-taking zones

Understanding these relationships helps traders navigate cryptocurrency price volatility more effectively. By identifying key support and resistance levels, market participants can establish trading zones where they anticipate significant price action, manage risk more precisely, and capitalize on market movements. This technical foundation directly influences how traders respond to price fluctuations across different market conditions.

Bitcoin-Ethereum Correlation Dynamics: Understanding Cross-Asset Price Movements and Market Dependencies

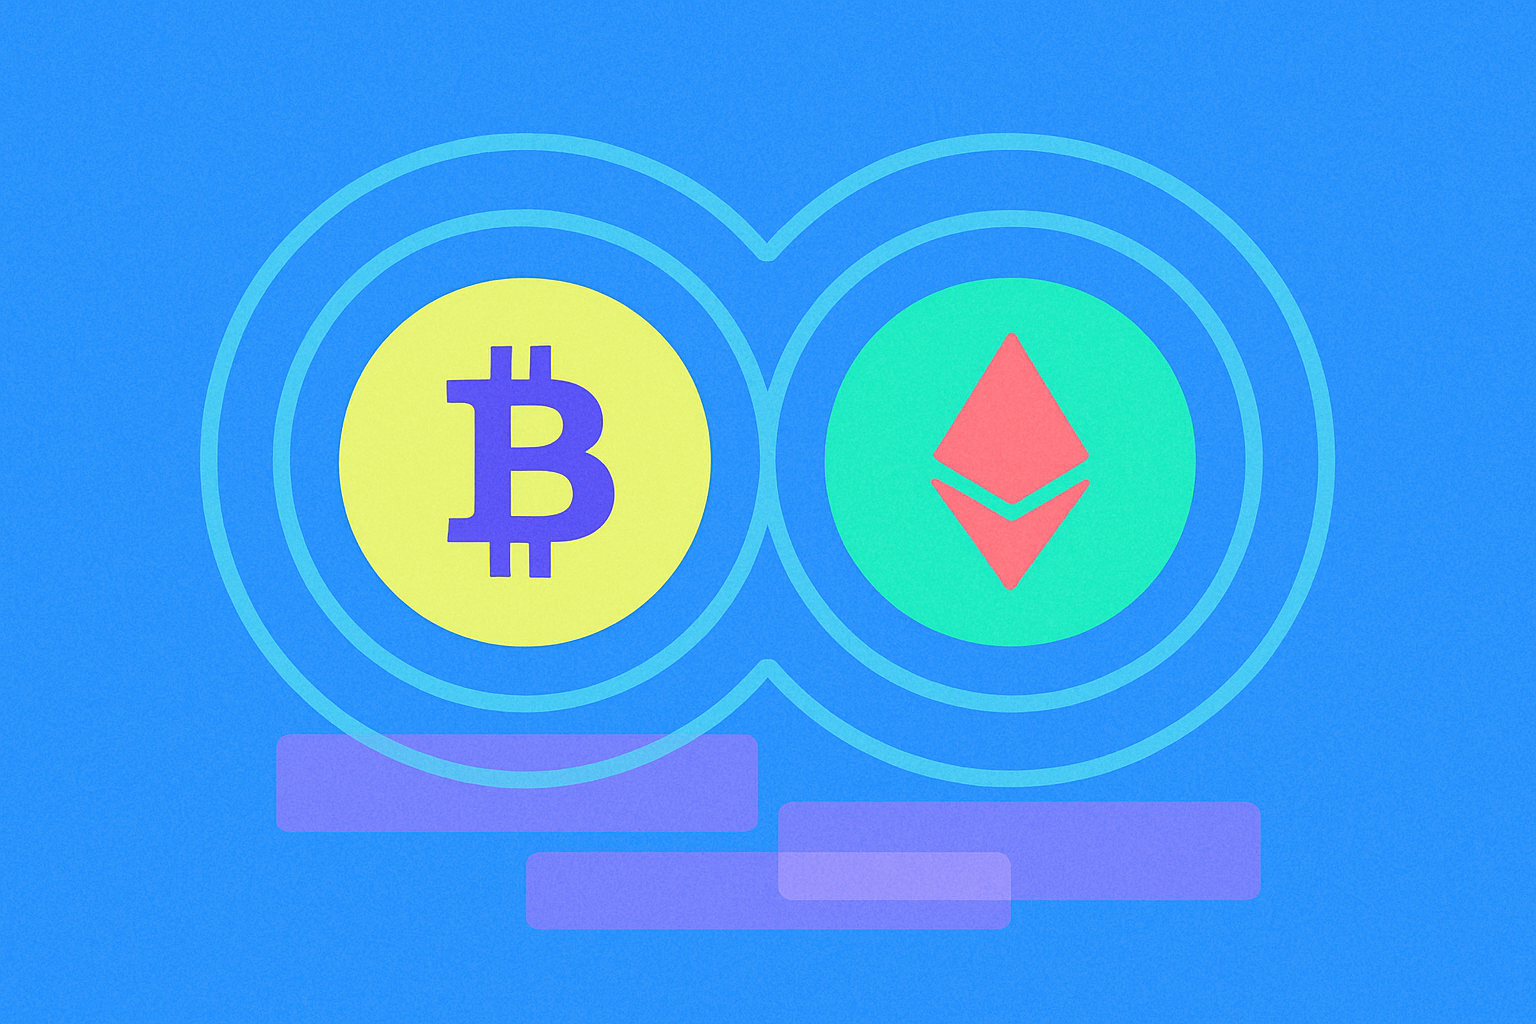
Bitcoin and Ethereum represent the two largest cryptocurrencies by market capitalization, and their price movements frequently exhibit strong interdependencies that shape broader market behavior. Understanding Bitcoin-Ethereum correlation dynamics reveals how these assets respond to market conditions and regulatory developments, providing critical insights for traders and portfolio managers.

The correlation between Bitcoin and Ethereum typically ranges from 0.7 to 0.9, indicating they move in the same direction during most market cycles. When Bitcoin experiences significant price movements, Ethereum generally follows a similar trajectory, though often with different amplitudes. This cross-asset price movement pattern reflects their shared exposure to macro factors including regulatory announcements, macroeconomic conditions, and shifts in investor sentiment toward cryptocurrency markets overall.

Market dependencies between these assets stem from several sources. First, Bitcoin dominance—the percentage of total cryptocurrency market cap held by Bitcoin—directly influences Ethereum's price dynamics. When Bitcoin strengthens relative to the broader market, capital often flows from alternative cryptocurrencies toward Bitcoin, creating downward pressure on Ethereum. Conversely, periods of Bitcoin consolidation frequently enable Ethereum to outperform, as investors diversify into other major digital assets.

Second, both cryptocurrencies respond to identical liquidity conditions and macroeconomic pressures, particularly central bank policies and inflation data. During risk-off market environments, both assets typically decline simultaneously, while risk-on periods support gains for both. Understanding these correlation patterns and market dependencies enables traders to better anticipate Bitcoin-Ethereum price movements and optimize their trading strategies accordingly.

FAQ

What drives crypto volatility?

Crypto volatility stems from market sentiment shifts, regulatory news, macroeconomic factors, trading volume fluctuations, and correlation with traditional assets. Bitcoin-Ethereum dynamics and support/resistance levels further influence price swings in this emerging asset class.

What is the correlation between Bitcoin and Ethereum?

Bitcoin and Ethereum show strong positive correlation, typically ranging from 0.7 to 0.85. They often move in the same direction due to shared market sentiment, macroeconomic factors, and regulatory news. However, correlation varies over time and Ethereum occasionally diverges based on network developments and DeFi ecosystem dynamics.

What drives crypto prices up?

Crypto prices rise through increased demand, positive market sentiment, institutional adoption, technological upgrades, Bitcoin dominance, regulatory clarity, macroeconomic conditions, and growing transaction volume in the market.

What are the key factors influencing the volatility of cryptocurrency prices and how do they compare to traditional financial assets?

Cryptocurrency volatility stems from market sentiment, regulatory news, trading volume, and macroeconomic factors. Unlike traditional assets, crypto markets operate 24/7 with lower liquidity, higher speculation, and rapid sentiment shifts, creating substantially greater price swings.

How do support and resistance levels help predict cryptocurrency price movements?

Support and resistance levels act as price boundaries where buying and selling pressure typically peaks. When price approaches support, buyers often step in, preventing further drops. At resistance, sellers emerge, capping upside. Breaking these levels signals strong momentum shifts, helping traders anticipate potential price direction and volatility changes.

What is the relationship between Bitcoin and Ethereum price movements, and how does it affect trading strategies?

Bitcoin and Ethereum show strong positive correlation, moving together approximately 70-80% of the time. When Bitcoin surges, Ethereum typically follows due to market sentiment. Traders use this correlation to diversify portfolios, hedge positions, or identify divergence opportunities for arbitrage strategies.

How do macroeconomic factors and market sentiment impact cryptocurrency price volatility?

Macroeconomic factors like inflation, interest rates, and economic data directly influence crypto prices. Market sentiment—driven by news, investor behavior, and fear or greed—amplifies volatility. Strong bullish sentiment pushes prices up, while negative sentiment triggers sharp declines. Together, they create cyclical price swings in crypto markets.

FAQ

What is night coin?

Night coin is a next-generation Web3 cryptocurrency designed for the decentralized ecosystem. Built on advanced blockchain technology, it enables fast, secure transactions with low fees. Night coin powers smart contracts and DeFi applications, creating value through community-driven governance and innovative tokenomics for long-term growth potential.

How much is one night coin?

NIGHT coin's price fluctuates based on market demand and trading volume. Current pricing is available on major cryptocurrency platforms. Check real-time market data for the latest NIGHT coin valuation and market trends.

How much is $night worth?

NIGHT coin's value fluctuates based on market demand and trading activity. Check real-time price data on major crypto platforms for current valuation. NIGHT's worth is determined by community adoption, ecosystem development, and overall market sentiment in the web3 space.

* The information is not intended to be and does not constitute financial advice or any other recommendation of any sort offered or endorsed by Gate.

Share

Content

Support and Resistance Levels: Identifying Key Price Barriers and Trading Zones

Bitcoin-Ethereum Correlation Dynamics: Understanding Cross-Asset Price Movements and Market Dependencies

FAQ

FAQ

Related Articles
Understanding Polygon Blockchain: A Comprehensive Guide

Understanding Polygon Blockchain: A Comprehensive Guide

This article explores the Polygon blockchain network, highlighting its significance as a layer-2 scaling solution for Ethereum. It discusses Polygon's technology innovations, including plasma chains, sidechains, and the zkEVM, which improve transaction speed and reduce costs. The guide further explains the role of the MATIC token and its applications across DeFi, NFTs, and gaming sectors. Readers will gain insights into Polygon's contributions to blockchain scalability, security, and decentralized governance, making it a key player in the Web3 ecosystem.
2025-12-05
Understanding the Basics of Smart Contracts

Understanding the Basics of Smart Contracts

"Understanding the Basics of Smart Contracts" explains the transformative role of smart contracts in blockchain technology. The article covers their definition, unique features such as automatic execution and reduced intermediaries, and origins with Nick Szabo and the Ethereum revolution. It guides readers through the lifecycle, from writing to deployment, and explores applications across DeFi, identity verification, and decentralized trading. Designed for tech enthusiasts and industry professionals, the article enhances understanding by comparing blockchains and smart contracts, providing examples such as Ethereum's ERC-20 standard.
2025-11-30
Layer 2 Scaling Made Easy: Bridging Ethereum to Enhanced Solutions

Layer 2 Scaling Made Easy: Bridging Ethereum to Enhanced Solutions

The article delves into Layer 2 solutions, focusing on optimizing Ethereum's transaction speed and cost efficiency through bridging. It guides users on wallet and asset selection, outlines the bridging process, and highlights potential fees and timelines. The article caters to developers and blockchain enthusiasts, providing troubleshooting advice and security best practices. Keywords like "Layer 2 scaling," "bridge services," and "optimistic rollup technology" enhance content scannability, aiding readers in navigating Ethereum's ecosystem advancements.
2025-12-24
ZK Rollups Explained: Enhancing Blockchain Scalability Through Zero-Knowledge Solutions

ZK Rollups Explained: Enhancing Blockchain Scalability Through Zero-Knowledge Solutions

This article delves into ZK Rollups, a key layer-2 scaling solution for Ethereum, enhancing blockchain scalability through zero-knowledge proofs. It addresses the challenges of high transaction costs and congestion in Ethereum's main chain, offering faster transactions and lower fees. Targeted at developers and users involved in Web3 and blockchain applications, the article explains the workings, benefits, and distinctions of ZK Rollups compared to optimistic rollups. Structured to provide clear insights on its applications in DeFi, gaming, and NFT trading, it highlights projects like Polygon, StarkWare, and Immutable X, portraying ZK Rollups as a pivotal technology in blockchain scalability.
2025-12-18
Understanding the Functionality of Polygon Sidechain Technology
Understanding the Functionality of Polygon Sidechain Technology

Explore the significance of Polygon, a pivotal blockchain solution enhancing Ethereum's scalability in the Web3 ecosystem, backed by major brands like Disney and Meta. Learn about its layer-2 sidechain technology, offering reduced transaction fees and improved speeds. Delve into MATIC's role in network security and governance, along with comparisons to Ethereum and other layer-2 solutions. Understand its diverse applications in DeFi, NFT trading, and blockchain gaming. Polygon's ongoing commitment to decentralization and security reforms emphasizes its importance in the blockchain industry's growth.
2025-12-20
What is the global crypto market overview in 2026: market cap rankings, trading volume, and liquidity analysis?
What is the global crypto market overview in 2026: market cap rankings, trading volume, and liquidity analysis?

# Global Crypto Market Overview in 2026: Market Cap Rankings, Trading Volume, and Liquidity Analysis This comprehensive analysis examines the 2026 cryptocurrency landscape, revealing how Bitcoin and Ethereum maintain dominant positions through institutional adoption and regulatory clarity. The article provides essential market intelligence covering multi-trillion-dollar valuations, daily spot trading volumes exceeding $100 billion across major exchanges including Gate, and circulation supply dynamics across 500+ trading platforms. Designed for institutional investors, crypto analysts, and market participants, this guide addresses critical questions about market cap rankings, liquidity infrastructure, and emerging asset distribution across North America, Europe, and Asia. By analyzing stablecoin infrastructure, exchange coverage rates, and trading volume metrics, readers gain actionable insights into 2026's institutional-grade crypto market maturity. The article progresses logically from market dominance asse
2026-01-02
Recommended for You
What is BULLA coin: analyzing whitepaper logic, use cases, and team fundamentals in 2026

What is BULLA coin: analyzing whitepaper logic, use cases, and team fundamentals in 2026

BULLA coin introduces decentralized accounting and on-chain data management innovation built on BNB Smart Chain, eliminating intermediaries while ensuring real-time transaction verification. The platform addresses critical gaps in cryptocurrency infrastructure by embedding accounting logic directly into smart contracts, enabling transparent audit trails and regulatory compliance. Real-world applications include seamless transaction imports across multiple exchanges, comprehensive crypto portfolio tracking, and secure record-keeping for investors. Trade import tools enhance user experience by automating data categorization and consolidation. Founded in 2021 by blockchain architect Benjamin with support from experienced fintech designers and engineers, BULLA Networks demonstrates active development momentum with continuous smart contract iterations through early 2026. The 2026-2027 strategic roadmap prioritizes network infrastructure expansion and enhanced security protocols, positioning BULLA as a robust decen
2026-02-08
What is on-chain data analysis and how does it reveal whale movements and active addresses in crypto?

What is on-chain data analysis and how does it reveal whale movements and active addresses in crypto?

On-chain data analysis reveals cryptocurrency market dynamics by examining active addresses and transaction metrics that expose whale movements and investor behavior. This comprehensive guide explores how blockchain data serves as a critical market indicator, demonstrating the correlation between large holder activities and price movements—such as FLOKI's 950% surge in whale transactions. The article covers whale movement tracking, holder distribution patterns showing 73.47% concentration among major stakeholders, and on-chain fee trends as cycle indicators. Essential metrics include active addresses reflecting genuine network participation, transaction volumes revealing strategic positioning, and network congestion patterns during market cycles. By tracking these interconnected indicators through platforms like Glassnode and Gate, investors and traders can identify market sentiment shifts, anticipate price movements, and distinguish institutional activity from retail participation, making on-chain analysis i
2026-02-08
What is Vodra (VDR) crypto: whitepaper logic, use cases, and fundamentals analysis for 2026
What is Vodra (VDR) crypto: whitepaper logic, use cases, and fundamentals analysis for 2026

Vodra (VDR) is a decentralized blockchain platform revolutionizing creator economics through AI-powered infrastructure and transparent compensation systems. The project addresses the creator economy's core challenge—unfair intermediary-controlled monetization—by enabling direct audience-to-creator transactions without traditional gatekeepers. VDR's whitepaper establishes a dual-layer architecture combining artificial intelligence for content assistance with blockchain verification for security and transparency. The platform's real-world applications extend from content monetization to DeFi ecosystem integration, real-world asset tokenization, and AI-driven automation by 2026. Founded by former Google engineer Yu Hu with backing from prominent investors like Dragonfly and The Spartan Group, Vodra positions itself at the intersection of Web3 infrastructure and creator empowerment. Key acquisition channels include Gate and other decentralized exchanges, with development roadmaps targeting API standardization, en
2026-02-08
How do cryptocurrency competitors compare in market share, performance, and user adoption in 2026?

How do cryptocurrency competitors compare in market share, performance, and user adoption in 2026?

This comprehensive analysis examines how major cryptocurrency competitors diverge across market share, performance, and user adoption in 2026. Bitcoin maintains dominance above 60% while institutional investors adopt core-satellite portfolios allocating 60-80% to Bitcoin and 15-25% to Ethereum. Layer-2 solutions command a decisive 40% market share advantage over legacy networks, with Solana leading at 1,133 TPS and driving institutional TVL beyond $50 billion. Regional adoption varies dramatically: Asia-Pacific accelerates at 11.6% CAGR driven by digital transformation, while North America concentrates 75% institutional users. Trading activity concentrates on Gate and leading platforms, with top five cryptocurrencies maintaining 61% combined market share. Understanding these divergent trajectories is essential for investors navigating competitive positioning and institutional capital flows.
2026-02-08
What is on-chain data analysis and how does it predict crypto market trends
What is on-chain data analysis and how does it predict crypto market trends

This comprehensive guide explores on-chain data analysis as a foundational tool for predicting cryptocurrency market trends. The article examines how blockchain metrics—including active addresses, transaction volume, and network health—reveal genuine market sentiment beyond price action alone. Key sections analyze whale movements as reliable leading indicators of market direction, demonstrating how large holder distribution patterns expose institutional positioning before broader price shifts occur. The guide further demonstrates how gas fee trends and network congestion serve as real-time sentiment gauges across different blockchain architectures. By tracking these on-chain indicators on platforms like Gate, traders can identify market opportunities before mainstream recognition. The article emphasizes that while on-chain analysis provides measurable predictive value through transaction flow analysis and holder behavior patterns, it functions best as a complementary tool alongside other market analysis metho
2026-02-08
How Does VeChain (VET) Community and Ecosystem Activity Compare to Other Layer 1 Cryptocurrencies in 2026?

How Does VeChain (VET) Community and Ecosystem Activity Compare to Other Layer 1 Cryptocurrencies in 2026?

This comprehensive analysis examines VeChain's community and ecosystem activity relative to competing Layer 1 blockchains in 2026. The article evaluates VeChain's multimillion-follower social infrastructure across Discord and Telegram, extensive developer ecosystem featuring 5,000+ DApps, and robust on-chain metrics with 2.5 million daily active addresses. Key findings highlight VeChain's enterprise-grade differentiation through supply chain solutions, institutional partnerships with Fortune 500 organizations, and proven real-world applications. While VeChain demonstrates lower developer numbers than Ethereum and Solana, its focused positioning in enterprise adoption, regulatory compliance through MiCA alignment, and strategic partnerships with DNV and Boston Consulting Group establish competitive advantages in B2B blockchain adoption, positioning VET as a distinctive Layer 1 leader within enterprise-centric ecosystems.
2026-02-08