

Search Token/Wallet
ICP's 4,200 TPS Explained: How to Measure Real Blockchain Network Activity
In November 2026, the network processing volume of [ICP](https://www.gate.com/learn/articles/what-is-icp/222) attracted market attention. According to Chainspect data, Internet Computer processed an average of approximately 4,200 TPS over the past 30 days, handling a cumulative total of approximately 10.886 billion records. At the same time, the price of ICP staged a short-term rebound, once again making the relationship between network performance, ecosystem adoption, and token value a key topic of discussion.
However, growth in TPS does not necessarily mean that the number of real users has increased, nor does it directly indicate that the network completed an equivalent number of asset transfers. For investors, understanding ICP's Canister architecture, network statistics, and computational resource consumption mechanism is essential to determining what these figures actually reflect in terms of demand and whether network activity can translate into long-term economic value.
## Key Takeaways
- ICP's recent figure of approximately 4,200 TPS reflects the average network processing volume during a specific statistical period. It cannot be directly equated with 4,200 ICP token transfers completed per second.
- ICP's Canister smart contracts support application execution and inter-contract messaging. Network activity therefore includes not only financial transactions but also a large number of computational operations.
- Transaction structures and TPS calculation methods differ across blockchains. Network performance or the actual user base cannot be assessed solely by ranking throughput.
- Assessing ICP's actual activity requires considering Update Calls, Query Calls, active applications, computational resource consumption, and token transaction data.
- There is no simple positive correlation between network processing volume and the value of ICP. Cycles consumption, token burns, and new supply are also important.
## What Does ICP's 4,200 TPS Figure Mean?
TPS is short for Transactions Per Second and is commonly used to measure the number of transactions a blockchain network processes per second. In traditional blockchain analysis, TPS is often viewed as an important indicator of network throughput. However, different blockchains do not define, execute, or measure transactions in exactly the same way. Therefore, even if two blockchains report the same TPS, this does not mean that they processed the same number of user requests, financial transactions, or computational tasks.
In mid-November 2026, the Internet Computer data displayed by Chainspect attracted attention. The relevant statistics showed that ICP processed an average of approximately 4,200.34 TPS over the previous 30 days, handling approximately 10.886 billion records in total, or about 363 million records per day. This indicates that ICP continuously processed a large volume of network operations during the relevant statistical period, reflecting a high level of activity in its application-oriented computing architecture.
However, understanding this figure requires distinguishing between average processing volume, instantaneous peaks, and the actual number of financial transactions. The 4,200 TPS figure is an average over a period of time. It does not mean that the network processed exactly the same number of operations every second, nor should it be viewed as ICP's maximum theoretical throughput. In addition to supporting token transfers, ICP can run applications, process state updates, and execute interactions between smart contracts. Its network activity may therefore include a large number of nonfinancial operations.
Another easily overlooked issue is that network processing volume does not equal the number of unique users. Even an application with only a small number of active users may generate a large number of network operations through background tasks, data processing, or interprogram communication. Therefore, 4,200 TPS is better viewed as a starting point for observing the scale of ICP network activity, rather than a definitive measure of user adoption or economic value.
## Why Does ICP's TPS Differ From the Transaction Count of Traditional Blockchains?
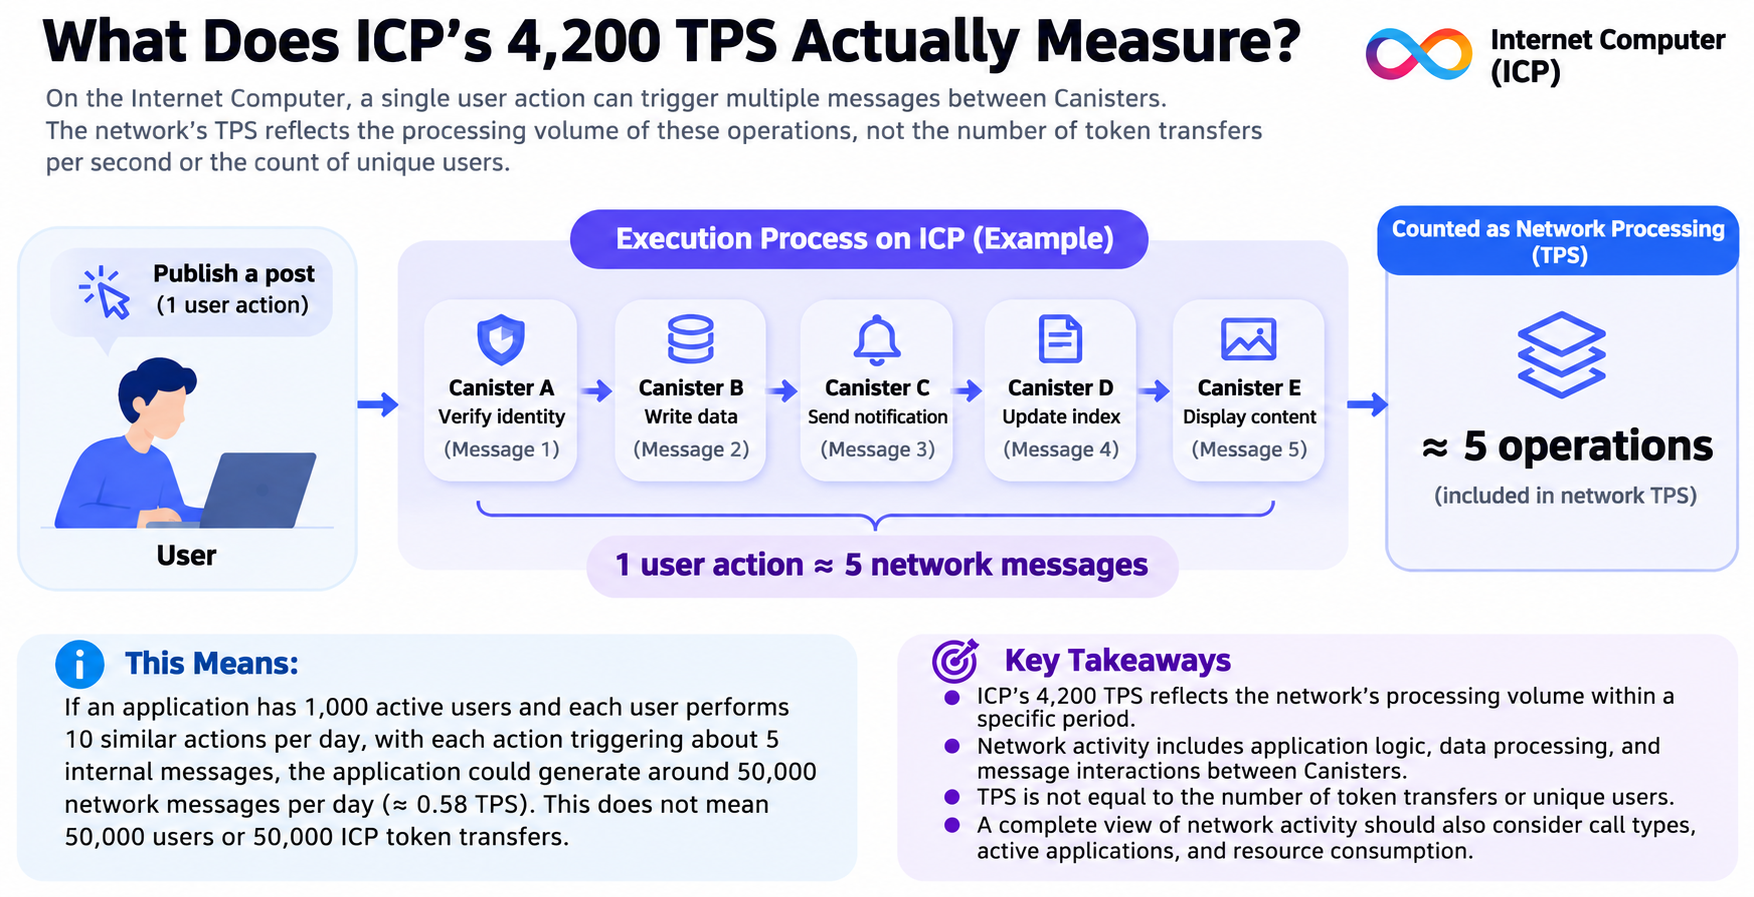
To understand ICP's network processing volume, it is first necessary to understand its Canister smart contract architecture. A Canister is a basic computational unit that runs applications on Internet Computer. It can contain both program code and persistent data, and can handle business logic execution, data processing, and application back-end functions. Compared with smart contracts primarily used for asset transfers and interactions with on-chain financial protocols, Canisters are designed more like continuously running software services. Their network activity therefore comes not only from requests initiated directly by users but also from programmatic communication between different Canisters.
For example, a social application deployed on ICP may include user authentication, content publishing, data storage, and message notifications. When a user publishes content, the front-end action may trigger interactions among multiple Canisters, with different modules handling permission verification, data updates, and notification tasks. Even if the user performs only one action, the back end may generate multiple messages. If an application has 1,000 active users, each of whom performs 10 actions per day, and each action triggers an average of five internal messages, the application may generate approximately 50,000 messages per day. This does not mean that it has 50,000 users or that 50,000 asset transfers occurred.
It is also necessary to distinguish between the ability of the Canister architecture to generate various types of network activity and the way Chainspect counts internal messages, queries, and responses in its TPS metric. Different data platforms may use different processing units and statistical rules. Their metric definitions and raw data should therefore be treated as the basis for interpretation. For ICP, the Canister messaging mechanism explains why network processing volume may differ substantially from the number of financial transactions. However, this architecture alone cannot be used to infer the complete calculation method of a third-party data platform.
Therefore, when analyzing ICP's network activity, user requests, smart contract calls, internal message execution, and token transactions on the ICP Ledger should be distinguished. These data points reflect different types of network activity. Only by examining them together can network usage be understood more accurately.
## What Is the Difference Between Update Calls and Query Calls?
Internet Computer network calls primarily include two types: Update Calls and Query Calls. They serve different functions, such as updating state and reading data, and are essential to understanding ICP's network performance.
Update Calls are generally used to modify a Canister's persistent state, such as updating account information, writing application data, or performing operations that change business state. These calls must go through the consensus and replicated execution processes of the relevant subnet. Their processing speed, computational resource consumption, and confirmation method are therefore affected by the network's consensus mechanism. For example, when a user edits a profile, submits information that must be stored persistently, or a smart contract updates a business state, the operation may involve Update Calls.
Query Calls are mainly used to read Canister data without changing persistent state. Ordinary Query Calls can be processed by a single node and do not need to go through the same consensus process as Update Calls, so they can generally provide faster responses. For example, when users open an application page, query public information, or view account data, Query Calls may be involved. Note that ordinary queries do not undergo full consensus verification, so their security properties differ from those of state-update operations confirmed through consensus.
| Comparison Dimension | Update Calls | Query Calls |
| --- | --- | --- |
| Primary use | Modify application state | Read application data |
| Consensus requirement | Generally requires consensus | Not required for ordinary queries |
| Persistent state | Can be modified | Cannot be modified |
| Performance characteristics | Affected by consensus and replicated execution | Generally faster response |
| Primary analytical value | State updates and computational activity | Data access and application reading demand |
The difference between these two types of calls shows that simply counting the number of operations processed per second is not enough to fully measure ICP's actual performance. A large number of ordinary queries may reflect application access demand but may not incur the same resource costs as state updates. A small number of complex Update Calls may consume substantially more computational resources. Therefore, network activity should be analyzed based on call type, number of execution instructions, response latency, and resource usage, rather than treating all operations as transactions of equal value.
## Can ICP's 4,200 TPS Be Directly Compared With Solana and Ethereum?
ICP, Solana, and Ethereum can all run smart contracts. However, their network architectures, transaction execution models, and statistical methods differ significantly. It is therefore not possible to determine which blockchain has greater practical value based solely on TPS figures.
Ethereum transactions are generally initiated by externally owned accounts and may involve asset transfers, contract deployment, or smart contract calls. Its network activity can be assessed using metrics such as transaction count, Gas consumption, active addresses, and protocol revenue. A Solana transaction can contain multiple instructions and is processed by the network as a single transaction unit. The number of transactions and the number of instructions actually executed are therefore not exactly the same. ICP, by contrast, builds its network architecture around Canister messaging and computational execution. Its network activity can reflect more of the operations involved in running applications.
These differences mean that even if a particular TPS metric for ICP is higher than that of another blockchain, it cannot be directly inferred that ICP has more real users, a higher payment volume, or greater economic revenue. For networks primarily serving DeFi and on-chain asset trading, transaction volume, active addresses, TVL, and protocol fees may offer greater analytical value. For an application-computing network such as ICP, Canister execution volume, computational instructions, storage usage, and Cycles consumption are more useful for understanding actual usage.
Network performance also includes transaction complexity, execution costs, confirmation latency, network stability, and failure rates. A blockchain that can quickly process a large number of simple operations may not maintain the same efficiency when executing complex smart contracts. Cross-chain performance comparisons therefore require a consistent testing environment and workload, rather than directly using TPS rankings displayed by different data platforms.
## How Can On-Chain Data Be Used to Assess ICP's Actual Network Activity?
Assessing ICP's actual network activity requires a multidimensional data analysis framework.
- Network call structure can be monitored, including metrics such as Update Calls, Query Calls, message execution volume, and the number of computational instructions. These data can help researchers determine whether network activity primarily comes from state updates, data reads, or interactions between programs. If total message volume grows rapidly while state updates and computational instruction consumption do not increase correspondingly, further analysis is needed to determine whether the growth is concentrated in certain low-cost operations. It should not be immediately interpreted as a significant increase in overall application demand.
- The actual usage of active applications and Canisters should be monitored. The number of deployed Canisters can reflect developer activity and the scale of application infrastructure, but deployment does not mean that an application continues to run and cannot directly prove the existence of stable user demand. More valuable than simply counting the total number of Canisters is observing changes in the number of active Canisters, whether network activity is concentrated in a small number of applications, and whether major applications can maintain long-term usage. For different use cases, including social applications, games, AI, and enterprise applications, user access, data processing, and resource consumption should also be assessed in the context of each business model.
- Computational resource consumption should be examined. ICP uses Cycles to pay for network resources such as computation, storage, and message processing. Cycles consumption therefore provides another perspective on resource usage. Compared with simply counting messages, computational resource consumption is closer to the actual workload handled by the network. However, it still cannot be directly equated with application revenue or end-user payment volume. Some resources may be subsidized by developers or may result from testing activities or applications that have not yet been commercialized. The quality of demand must therefore be assessed in conjunction with the use case.
- Token transaction data on the ICP Ledger should be examined separately, along with usage metrics for identity systems such as Internet Identity. Token transfers can reflect financial activity, while identity logins and application access can help assess usage. However, the number of identity accounts does not equal the number of unique individuals. Combining network processing volume, application activity, resource consumption, and financial transaction data can reduce the risk of misinterpretation caused by relying on a single metric.
## How Does Network Computing Demand Affect ICP Tokenomics?
ICP's tokenomics are directly linked to the network's computational resources. On Internet Computer, application developers or operators generally need to provide Canisters with Cycles to pay for resources such as computation, storage, and message processing. ICP can be converted into Cycles, during which the corresponding ICP is burned. The resulting Cycles are then used to support application operations. This mechanism connects network computing demand with ICP token consumption through resource fees.
The pricing mechanism for Cycles is linked to the International Monetary Fund's Special Drawing Rights (SDR). It is designed to prevent the cost of network computing resources from following fluctuations in the market price of ICP too closely. For application developers, this design helps make computing costs more predictable. For tokenomics, if more applications continue using network resources, this could theoretically increase demand for Cycles and drive corresponding ICP conversion and burns.
However, growth in network usage does not mean that ICP burns will necessarily increase in direct proportion. Different operations consume significantly different amounts of resources. A large number of low-cost messages may generate only limited resource fees, while complex computation, continuous data storage, and high-load applications may result in higher Cycles consumption. In addition, ordinary Query Calls do not directly incur query fees for Canisters, so the number of queries cannot be used to simply calculate the amount of tokens burned.
ICP's market price is also affected by factors including new token supply, node rewards, governance rewards, locked-token structures, and market liquidity. The Mission 70 tokenomics reform proposal introduced in 2026 focuses on reducing token issuance and promoting growth in computing demand. However, the proposal's objectives should not be treated as an already achieved deflationary outcome. Investors should instead monitor long-term Cycles consumption, the actual amount of ICP burned, and net changes in supply, rather than relying solely on TPS growth to value the token.
## Is ICP's Recent Rally Related to a Record TPS?
In mid-November 2026, ICP staged a short-term rebound. Market data around November 16 showed that ICP had risen by approximately 15.7%, with its price reaching around \$2.52. During the same period, records for ICP's network processing volume attracted market attention. Infrastructure products such as Cloud Engines, promoted by DFINITY, also generated new market discussion, bringing ICP's decentralized computing capabilities back into focus for investors.
From a market narrative perspective, there is some connection between growth in network throughput, the development of application infrastructure, and demand for AI application deployment. Cloud Engines aims to provide cloud computing infrastructure based on Internet Computer, while Caffeine explores helping users build and deploy applications through natural-language interaction. If these initiatives can continue attracting developers and enterprises, they may further expand demand for network computing resources and establish a connection with ICP tokenomics through Cycles consumption.
However, technological progress and short-term price increases do not have a necessary causal relationship. ICP's market performance remains affected by factors such as overall crypto market trends, trading volume, leveraged positions, capital flows, and investor sentiment. Even if network processing volume reaches a period high, it is still necessary to verify whether the growth comes from sustainable application demand and whether that demand can translate into stable resource consumption.
For long-term investors, more important than a single price rebound is whether network activity can grow over multiple consecutive quarters, whether major applications can form stable user bases, and whether demand for computing resources can improve the tokenomics. Only when these changes are continuously validated can growth in network performance gradually translate into more convincing fundamental support.
## Which Metrics Should Investors Monitor to Assess ICP's Long-Term Value?
ICP's long-term value can be assessed through a research framework covering three levels: network performance, ecosystem adoption, and tokenomics. Network performance primarily reflects whether Internet Computer can reliably handle complex computational tasks. Ecosystem adoption focuses on whether developers and users are willing to continue using the relevant infrastructure. Tokenomics helps determine whether demand for network usage can further affect the supply and demand of ICP.
| Research Level | Key Metrics | Primary Question |
| --- | --- | --- |
| Network performance | Update TPS, Query TPS, number of computational instructions, latency | Can the network reliably handle actual computational tasks? |
| Ecosystem adoption | Active applications, Canister activity, user activity, storage demand | Is sustainable demand for real applications emerging? |
| Tokenomics | Cycles consumption, ICP burns, new supply, governance lockups | Can network usage create sustainable demand for the token? |
These three levels should be analyzed together. If ICP's network processing volume continues to increase while active applications expand and computational resource consumption rises, this may indicate that the ecosystem is developing stronger real usage demand. Conversely, if TPS growth primarily comes from internal operations of a small number of applications, while resource consumption and user numbers do not change accordingly, the quality of that growth should be assessed cautiously.
At the tokenomics level, even if demand for network computing continues to improve, the relationship between new ICP supply and market demand must also be considered. If the scale of burns is insufficient to offset new issuance, increased network usage may still not result in a contraction of token supply. In addition, the degree of application commercialization, developer retention, and enterprise adoption will also affect the market's assessment of ICP's long-term value.
Therefore, ICP analysis should not stop at the TPS ranking at a particular point in time. It should examine whether technical capabilities can translate into sustained application adoption and whether that adoption can create verifiable economic demand. Only by connecting network performance, actual usage, and tokenomics can a more complete long-term analytical framework be established.
## Summary
Internet Computer's recent monthly average processing volume of approximately 4,200 TPS reflects a high level of network activity during a specific statistical period and demonstrates the ability of its Canister architecture to support application interactions. However, ICP's network processing volume is measured differently from the number of financial transactions on traditional blockchains. It cannot be directly interpreted as the number of real users, the scale of asset transfers, or economic revenue.
For investors, TPS is better viewed as a starting point for observing technical network activity rather than the sole basis for assessing token value. What deserves sustained attention is whether ICP can convert its computing capabilities into stable application demand and establish long-term economic links through Cycles consumption, ICP burns, and changes in token supply. As application infrastructure such as Cloud Engines and Caffeine continues to develop, ICP's long-term value will increasingly depend on the formation of genuine computing demand, rather than simply on how many messages the network can process.
## FAQ
### Are ICP's 4,200 TPS Real Transactions?
This figure reflects network processing volume under a specific statistical methodology. It cannot be directly equated with 4,200 ICP token transfers or payment transactions per second. ICP's Canister architecture supports various types of application interactions, so the meaning of the data must be assessed in conjunction with the specific calculation method.
### Why Can ICP's TPS Be Higher Than That of Other Blockchains?
ICP's network can process messaging between applications, while different blockchains use different methods to count transactions and executed operations. Therefore, TPS rankings do not directly represent financial transaction capacity or the actual user base on a comparable basis.
### Will Growth in ICP's TPS Drive the Token Price Higher?
Not necessarily. Growth in TPS can form a clearer economic connection only if it creates sustained demand for computational resources and further affects Cycles consumption, ICP burns, and market supply and demand. Short-term price movements are still affected by market sentiment and capital flows.
### What Are Cycles in ICP?
Cycles are the unit used by Internet Computer to pay for network resources such as computation, storage, and message processing. Developers can obtain Cycles by converting ICP and use them to support the continued operation of Canisters.
### How Can I View ICP's Actual Network Data?
You can use the Internet Computer Dashboard, metric interfaces provided in ICP developer documentation, and third-party platforms such as Chainspect to monitor network calls, message execution, computational resource consumption, and token transaction activity. Data from different platforms should be compared in light of their respective statistical methodologies.
Author: Learn Team
* The information is not intended to be and does not constitute financial advice or any other recommendation of any sort offered or endorsed by Gate Web3.
* This article may not be reproduced, transmitted or copied without referencing Gate Web3. Contravention is an infringement of Copyright Act and may be subject to legal action.
Related Articles

Beginner
Will Sidra Break $1,000? A Realistic Look at Sidra Chain Price Claims in 2026–2027
Sidra Chain positions itself as a Shariah-compliant blockchain for users who want crypto activity without interest (riba), excessive uncertainty (gharar), or non-halal assets. That narrative explains why the project still has a large community around mining, KYC, SidraStart, and a future SDA listing. It does not, by itself, create a public market price.

Beginner
BlockDAG (BDAG): A High-Speed and Secure Layer 1 for the Next Era
BlockDAG leverages a parallel PoW and DAG architecture to break through the bottlenecks of conventional single-chain designs, delivering high throughput at 10 BPS (with a target of 100+ BPS) and second-level transaction confirmation—all while preserving the Bitcoin-grade security provided by PoW.

Beginner
Rising Prices but Bearish Funding Rates: Is Crypto Entering a “Layered Bull Market” After Wall Street Capital Inflows?
In mid-April, the crypto marketplace saw a unique scenario where a price rebound coincided with a bearish funding rate. This article dissects the new structure behind the capital mismatch between spot and futures by analyzing Goldman Sachs' application for the Bitcoin Premium Income ETF, shifts in ETF capital flows, the renewed activity of ETH, and Coinglass fee rate data. It further provides an actionable three-indicator observation framework and corresponding risk management approaches.
Beginner
What is USDC? A Complete Guide to One of the Most Trusted Stablecoins
USDC is a stablecoin pegged 1:1 to the U.S. dollar, jointly launched by Circle and Coinbase, and governed by the Centre Consortium.

Beginner
Fractional NFTs: Lowering Barriers and Enhancing Liquidity
Fractional NFTs divide unique, indivisible NFTs into tradable shares, allowing a broader range of investors to access high-value digital asset trades and significantly enhancing liquidity within the NFT marketplace.

Beginner
USDD vs USDT: A Comparison of Stablecoin Mechanisms, Risks, and Use Cases
The core differences between USDD and USDT lie in their issuance models, stabilization mechanisms, and risk structures. USDD is an overcollateralized stablecoin with higher yield potential, while USDT is issued by a centralized entity and backed by fiat reserves, relying on redemption mechanisms and market trust to maintain its peg. USDT offers stronger liquidity but comes with regulatory and custodial risks. Each serves different user needs: USDT is better suited for trading and hedging, while USDD is designed for DeFi yields and on-chain applications.