Mastering the BTC Dominance Chart: The Key Indicator in the Crypto Market
What Is the BTC Dominance Chart?
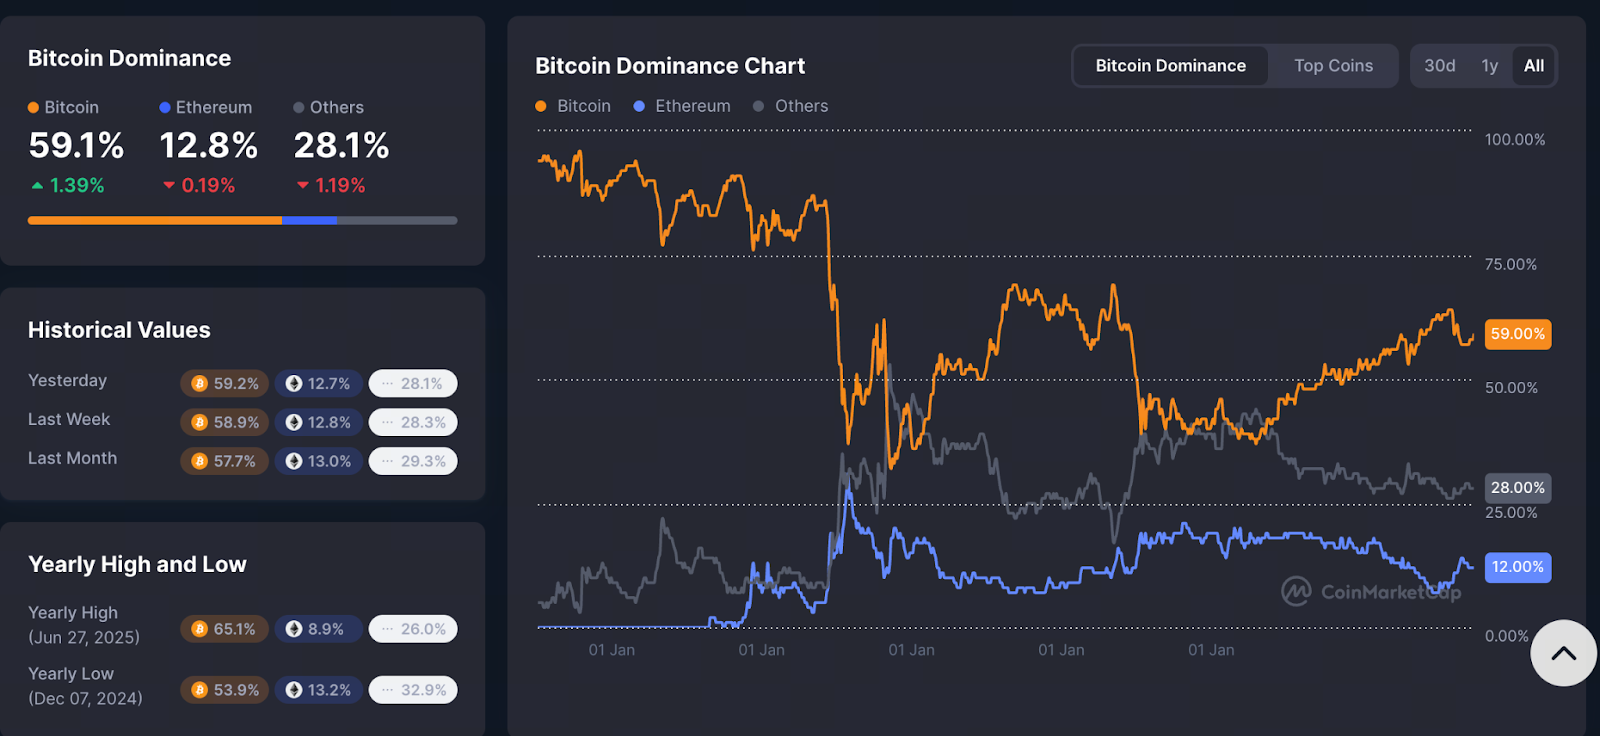
Chart: https://coinmarketcap.com/charts/bitcoin-dominance/
In the crypto market, “Dominance” refers to Bitcoin’s (BTC) share of total cryptocurrency market capitalization. In short: BTC Dominance = Bitcoin market cap ÷ (total market cap of all cryptocurrencies) × 100%.
For instance, when Bitcoin holds more than half of total market share, most capital is favoring Bitcoin. If the ratio drops, it may signal a shift of funds toward altcoins. The BTC Dominance Chart is a crucial tool for tracking shifts in overall crypto market structure and capital flow trends.
Latest Developments in the BTC Dominance Chart
Based on real-time data, Bitcoin’s current dominance is approximately 59%.
At the same time, multiple analyses indicate:
- Analysts indicate that BTC Dominance has reached an inflection point after years of upward momentum and may decline.
- There are signs of “divergence”—while dominance remains high, momentum is waning, which could indicate an approaching Alt Season.
- Conversely, some analysts believe that if Bitcoin’s price stays strong and dominance rebounds, a Bitcoin-led bull market may follow.
These recent changes highlight the importance of this indicator for new investors, as it can signal potential market turning points.
Why Is It Important for New Investors?
New investors often focus on price swings and overlook broader market structure changes. The BTC Dominance Chart provides a macro-level perspective:
- When BTC Dominance rises: Capital is concentrating in Bitcoin, signaling a preference for safe haven assets. Altcoins may underperform during these periods.
- When BTC Dominance falls: Risk appetite increases, and capital may flow into altcoins—potentially marking the start of an Alt Season.
For beginners, watching this ratio helps you decide whether to prioritize Bitcoin or consider adding altcoins to your portfolio. While not all altcoins will rise, this serves as a useful tool for assessing market conditions.
How to Use the BTC Dominance Chart to Inform Decisions?
Here are several practical tips:
Analyze the BTC Dominance ratio and Bitcoin’s price directly:
- If Bitcoin price ↑ and Dominance ↑: Capital is concentrated, and Bitcoin may be leading a bull market.
- If price ↑ but Dominance ↓: Funds may be moving from Bitcoin to altcoins, creating more altcoin opportunities.
- If price ↓ and Dominance ↑: The market is turning risk-averse, and Bitcoin is relatively safer.
Identify key support and resistance levels: Historically, BTC Dominance around 60% has been a significant threshold.
Combine capital flows and market sentiment: Dominance is just one tool; it should be used together with price trends, news, and on-chain data for a well-rounded analysis.
Adjust portfolio and manage risk: If Dominance drops clearly, beginners can cautiously try small altcoin allocations; if it rises, focus on Bitcoin and manage exposures carefully.
Risk Notice and Practical Advice
- BTC Dominance is a valuable reference but not an absolute signal. Sudden market reversals may occur due to regulatory actions or unforeseen events.
- Altcoins are far riskier than Bitcoin—while they offer greater upside, volatility is much higher. New investors should only invest funds they can afford to lose.
- Do not view Dominance in isolation: combine it with Bitcoin price action, overall market cap, and liquidity data.
- You may not see immediate effects: Even if Dominance changes, effects may not be immediate. Patience is essential for beginners.
Conclusion
For crypto newcomers, understanding the BTC Dominance Chart as a “macro barometer” is extremely valuable. Currently, the indicator is in a key range and likely signaling a shift in market structure. By tracking the BTC Dominance ratio and Bitcoin price, you can assess whether the market is entering a Bitcoin-led phase or if altcoin opportunities are emerging. Remember, no single indicator is foolproof—use multi-dimensional data and solid risk management to participate in the market more confidently.
Related Articles

The New Era of the NFT Market: From Explosive Peaks to Rational Transformation

The Next 100x Coin? Low-Cap Crypto Gem Analysis

MathWallet Quick Start Guide

Zora NFT Market Update: ZORA Token Airdrop, Layer-2 Expansion, and Creator Incentive Mechanisms

Ethereum Whales Revealed: Who Are the True ETH Giants in 2025?
