Gate Wiki
Gate Wiki empowers users with accessible crypto and blockchain knowledge, delivering trusted token research, industry analysis, trend forecasts, and market insights.

Gate Wiki Topics
Topics
Bitcoin
Ethereum
XRP
Tether
Solana
BNB
Doge
ADA
USDC
TRON
Shiba Inu
Toncoin
Memecoins
AI
RWA
Gaming
DePIN
Altcoins
Blockchain
DeFi
GameFi
Metaverse Crypto
NFTs
Trading Fee
P2P Trading
Stablecoin
Crypto Insights
Investing In Crypto
Crypto staking
Spot Trading
Web 3.0
Crypto Trading
New Cryptocurrencies
Crypto Tutorial
Trading Bots
BRC-20
DAO
Macro Trends
SocialFi
Liquid Staking
Zero-Knowledge Proof
Airdrop
Crypto Ecosystem
Layer 2
Payments
Mining
How to buy crypto
Web3 wallet
Crypto glossary
ETF
Futures Trading
Crypto Loans
Crypto Deposit
Crypto Withdrawal
Bitcoin Halving
Cryptocurrency market
Grid Bot
Inscriptions
K-line
Telegram Mini App
P2E
Cosmos
PoW
CTA
Top crypto
Pre-Market
Price Prediction
Pi Network

At-the-Money
This comprehensive guide explores At-the-Money (ATM) options, a crucial financial instrument where strike prices equal current market prices. ATM options offer traders exceptional sensitivity to price movements with lower premiums than in-the-money alternatives, making them ideal for both hedging and speculation strategies. The guide covers practical examples including equity and digital asset markets, explains how modern trading technology and algorithms optimize ATM option pricing through models like Black-Scholes, and demonstrates real-world applications across straddles, strangles, and protective strategies. Investors benefit from ATM options' superior liquidity and flexibility for portfolio management, risk mitigation, and leveraged exposure without substantial capital outlay. Whether trading on Gate or other platforms, ATM options remain essential for implementing sophisticated trading strategies across traditional securities, commodities, forex, and cryptocurrency markets, providing traders at all leve
2026-01-09 17:06:30
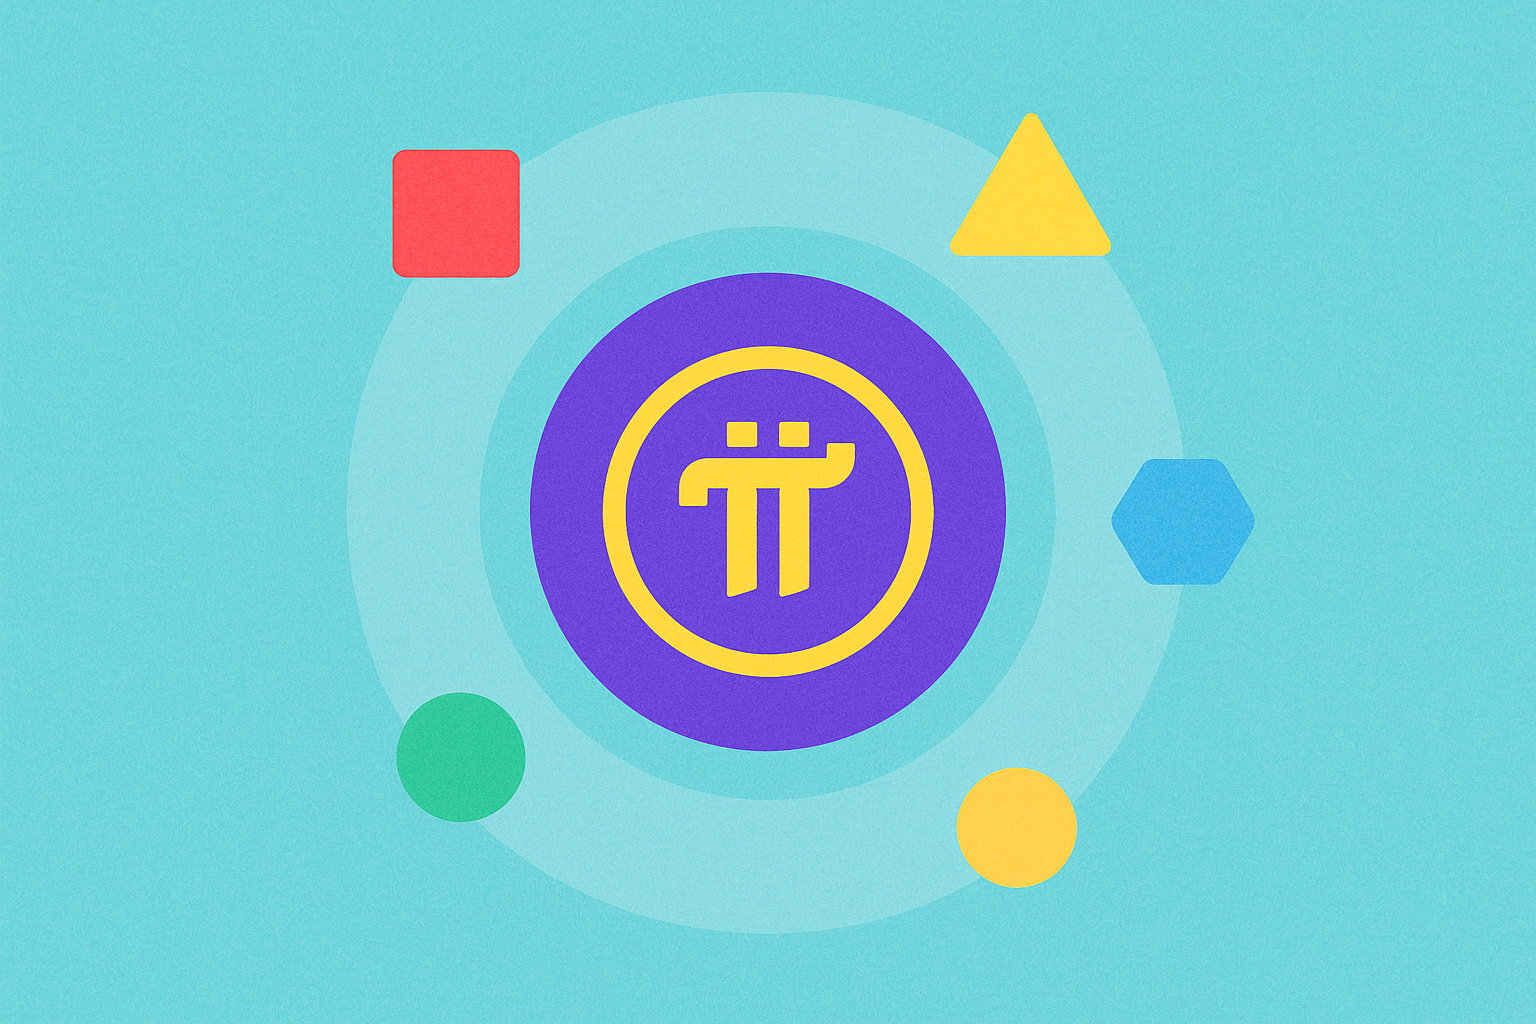
What is Pi Coin? A Complete Guide to Pi Network Value, Price & How to Sell Pi Coin
Discover Pi Coin and the Pi Network: A comprehensive guide to the most accessible cryptocurrency platform designed for mobile mining. Founded by Stanford PhDs Nicolas Kokkalis and Chengdiao Fan, Pi Network allows users to mine cryptocurrency directly from smartphones without specialized equipment or technical expertise. Unlike energy-intensive Bitcoin mining, Pi uses the Stellar Consensus Protocol for efficient, sustainable operations. The ecosystem features four user roles—Pioneers, Contributors, Ambassadors, and Node Operators—each earning different rewards. With 100 billion maximum Pi coins (80% community allocation), users can now trade on Gate after KYC verification and mainnet migration. This article covers Pi Network fundamentals, tokenomics, mining mechanics, security features, and step-by-step trading instructions. Perfect for newcomers seeking reliable information about Pi coin's legitimacy, potential value, and real-world applications in building a decentralized payment system accessible to everyon
2026-01-09 17:00:05

Is Crypto Legal in India?
This article provides a comprehensive guide to cryptocurrency regulations in India, exploring the legal status, regulatory framework, and practical implications for investors and businesses. It covers India's regulatory evolution from the RBI's 2018 banking restrictions to the Supreme Court's landmark 2020 ruling and recent legislative updates that classify cryptocurrencies as digital assets. The article highlights how clear regulations have enabled institutional investments exceeding $40 billion, attracted 20 million active users, and driven 50% growth in blockchain adoption across finance, supply chain, and healthcare sectors. Key topics include taxation policies, exchange licensing requirements, AML compliance standards, and real-world applications of blockchain technology. Designed for investors, traders, and entrepreneurs, this resource clarifies legal requirements, tax obligations, and opportunities within India's maturing crypto ecosystem.
2026-01-09 16:47:32

Is Crypto Mining Legal in Nepal?
Nepal maintains strict prohibition on cryptocurrency mining, trading, and possession under central bank enforcement, making legal clarity essential for investors and businesses. The Nepal Rastra Bank continues restrictive regulations treating crypto activities as illegal, with periodic enforcement actions including website blocking and equipment seizures. Unlike neighboring countries such as India and Singapore that develop regulatory frameworks, Nepal's stance constrains domestic innovation and foreign investment in blockchain technologies. Understanding these legal boundaries helps stakeholders identify alternative blockchain applications in supply chain, healthcare, and education sectors while ensuring compliance. For individuals committed to mining, operational relocation to crypto-friendly jurisdictions on platforms like Gate remains advisable. Nepal's regulatory environment reflects broader global debates on balancing financial stability, consumer protection, and technological innovation in digital asse
2026-01-09 16:45:43

Is Crypto Considered Haram?
Islamic views on cryptocurrency: Explore whether crypto is considered halal or haram, review Shariah compliance standards, discover certified cryptocurrencies like Islamic Coin, and identify halal crypto investment opportunities. This complete guide serves Muslim investors on Gate and other reputable platforms that offer halal certification from recognized Islamic scholars.
2026-01-09 16:16:29

What Is Shiba Inu (SHIB)? How to Buy, Price Predictions, and a Comprehensive Guide for Beginners
The definitive Shiba Inu guide for beginners: discover what SHIB is, explore its history, understand how the ecosystem operates, learn how to purchase tokens, review 2024 price forecasts, and master staking rewards strategies. Covering everything from fundamentals to intelligent investing on Gate.
2026-01-09 16:10:43

What is Hyperlane (HYPER)? The Ultimate Guide to Cross-Chain Bridge Technology and Token
This comprehensive guide explores Hyperlane, a permissionless interoperability protocol revolutionizing cross-chain communication by connecting 140+ blockchains without centralized intermediaries. Designed for developers, DeFi users, and blockchain investors, the article addresses critical industry challenges including fragmented ecosystems, centralized bridge vulnerabilities, and poor cross-chain user experience. The guide details Hyperlane's core technology including modular Interchain Security Modules, Warp Routes for asset bridging, and universal messaging capabilities, while thoroughly explaining HYPER token economics, staking mechanisms, and validator rewards. You'll discover real-world applications spanning token bridging, cross-chain DeFi, and NFT platforms, alongside comparative advantages over competing solutions like LayerZero and Wormhole. The article concludes with Hyperlane's vision of seamless blockchain interoperability and future development roadmap, providing essential insights into the next
2026-01-09 15:53:43
Unlock the Secret Cipher and Claim Your Bonus in Hamster Kombat
This comprehensive guide covers Hamster Kombat's Daily Cipher system, a viral Telegram clicker game feature rewarding players with 1 million in-game coins for solving daily Morse code puzzles. The article provides step-by-step instructions for entering cipher codes using short taps and long presses, includes a complete Morse code reference chart, and explains the strategic importance of consistent participation for accelerating game progression. Readers will discover how the cipher system enhances engagement, understand the underlying crypto gaming ecosystem including Bitcoin and Ethereum infrastructure, and learn withdrawal mechanisms through major exchanges like Gate. Ideal for both casual gamers and crypto enthusiasts seeking to maximize in-game rewards and progress efficiently.
2026-01-09 15:36:10
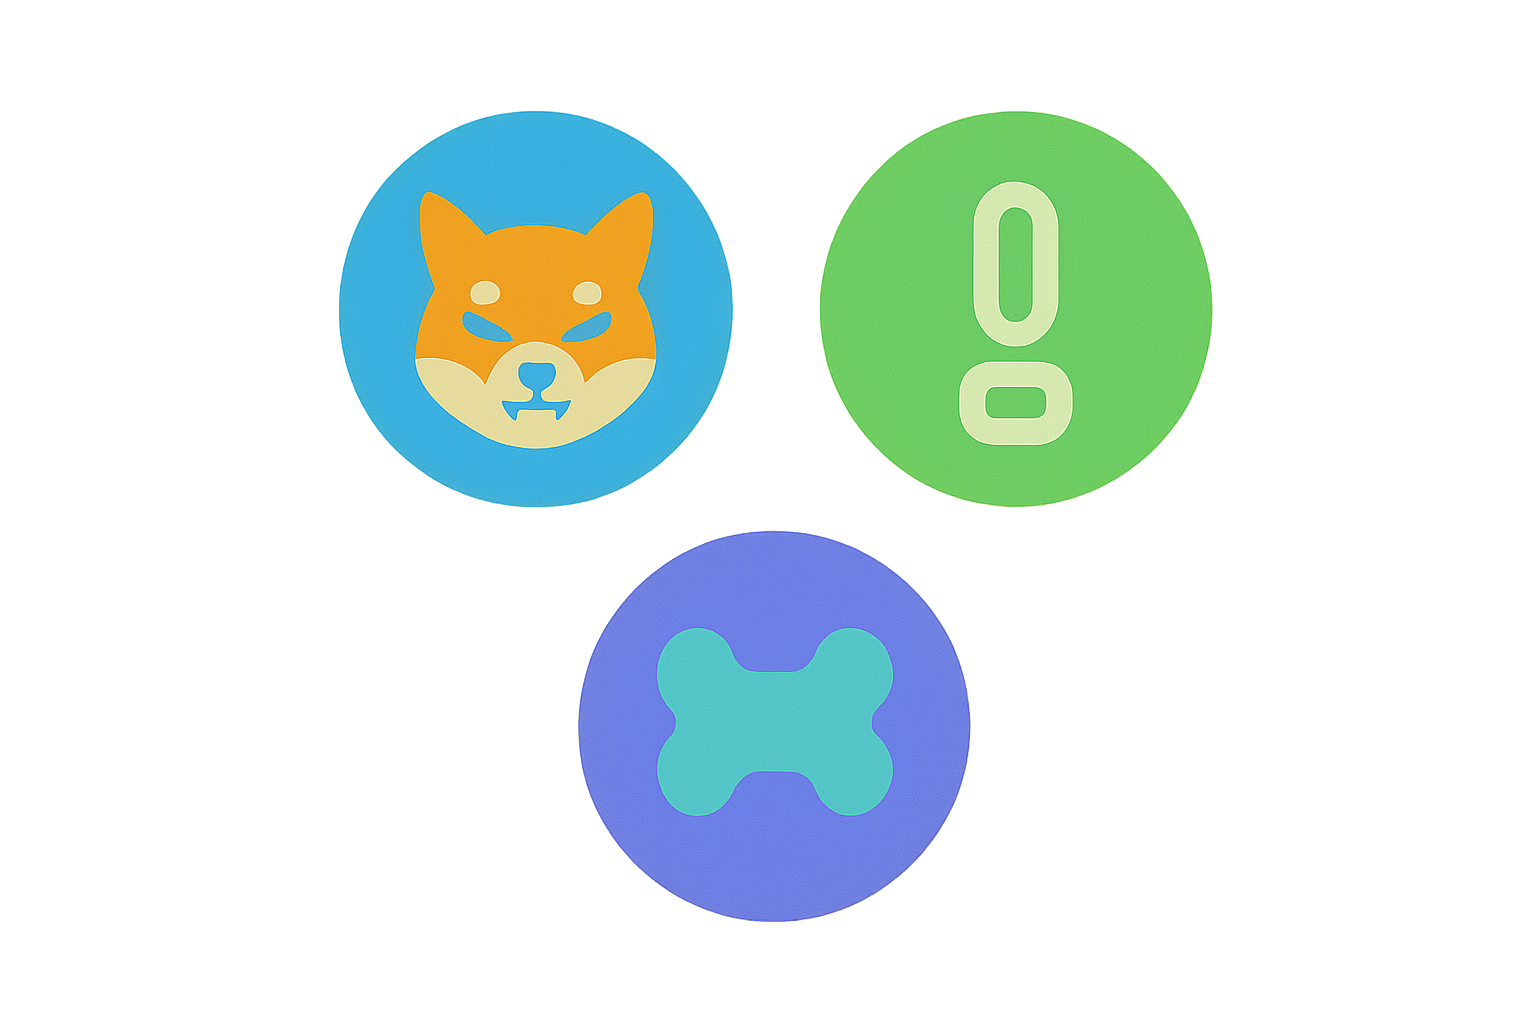
Shiba Inu: The Dogecoin Killer
Shiba Inu (SHIB) is a community-driven cryptocurrency that evolved from a meme coin into a comprehensive blockchain ecosystem built on Ethereum. This beginner's guide explores SHIB's journey from August 2020 inception to its position among top cryptocurrencies, covering its three-token system (SHIB, LEASH, BONE) and ecosystem applications including ShibaSwap decentralized exchange and Shibarium Layer 2 solution. Learn how to purchase SHIB on Gate and other major exchanges, understand the project's market performance with its dramatic price history and high trading volume, and evaluate both opportunities and risks involved in crypto investing. The guide examines SHIB's passionate community (ShibArmy), expanding real-world adoption, and ambitious future developments including metaverse integration and algorithmic stablecoin launch. Ideal for investors seeking to understand meme coins, DeFi platforms, and cryptocurrency ecosystems, this resource provides practical purchasing instructions, security best practices
2026-01-09 15:33:54

Fill or Kill Order
A complete guide to FOK (Fill or Kill) orders. Learn how this limit order works, explore its role in trading strategies and market dynamics, and discover how to leverage FOK orders on platforms like Gate for precise execution, effective risk management, and safeguarding your investment returns. This guide is tailored for cryptocurrency traders and digital asset investors.
2026-01-09 15:20:55

DAO (Decentralized Autonomous Organization)
Decentralized Autonomous Organizations (DAOs) represent a revolutionary organizational model that operates on blockchain technology through smart contracts, eliminating traditional hierarchical management structures. This article provides a comprehensive exploration of DAOs, beginning with core concepts where rules are programmatically enforced rather than relying on human intermediaries. The mechanics section explains how governance tokens enable collective decision-making through automated smart contract execution. Key characteristics include decentralization, transparency, automation, and global accessibility that democratize organizational participation. DAOs apply across decentralized finance, investment pooling, community coordination, and protocol governance, managing billions in assets collectively. While offering advantages like reduced bureaucracy, trust-building transparency, and cost efficiency, DAOs face challenges including legal uncertainty, smart contract vulnerabilities, and scalability issue
2026-01-09 15:14:35
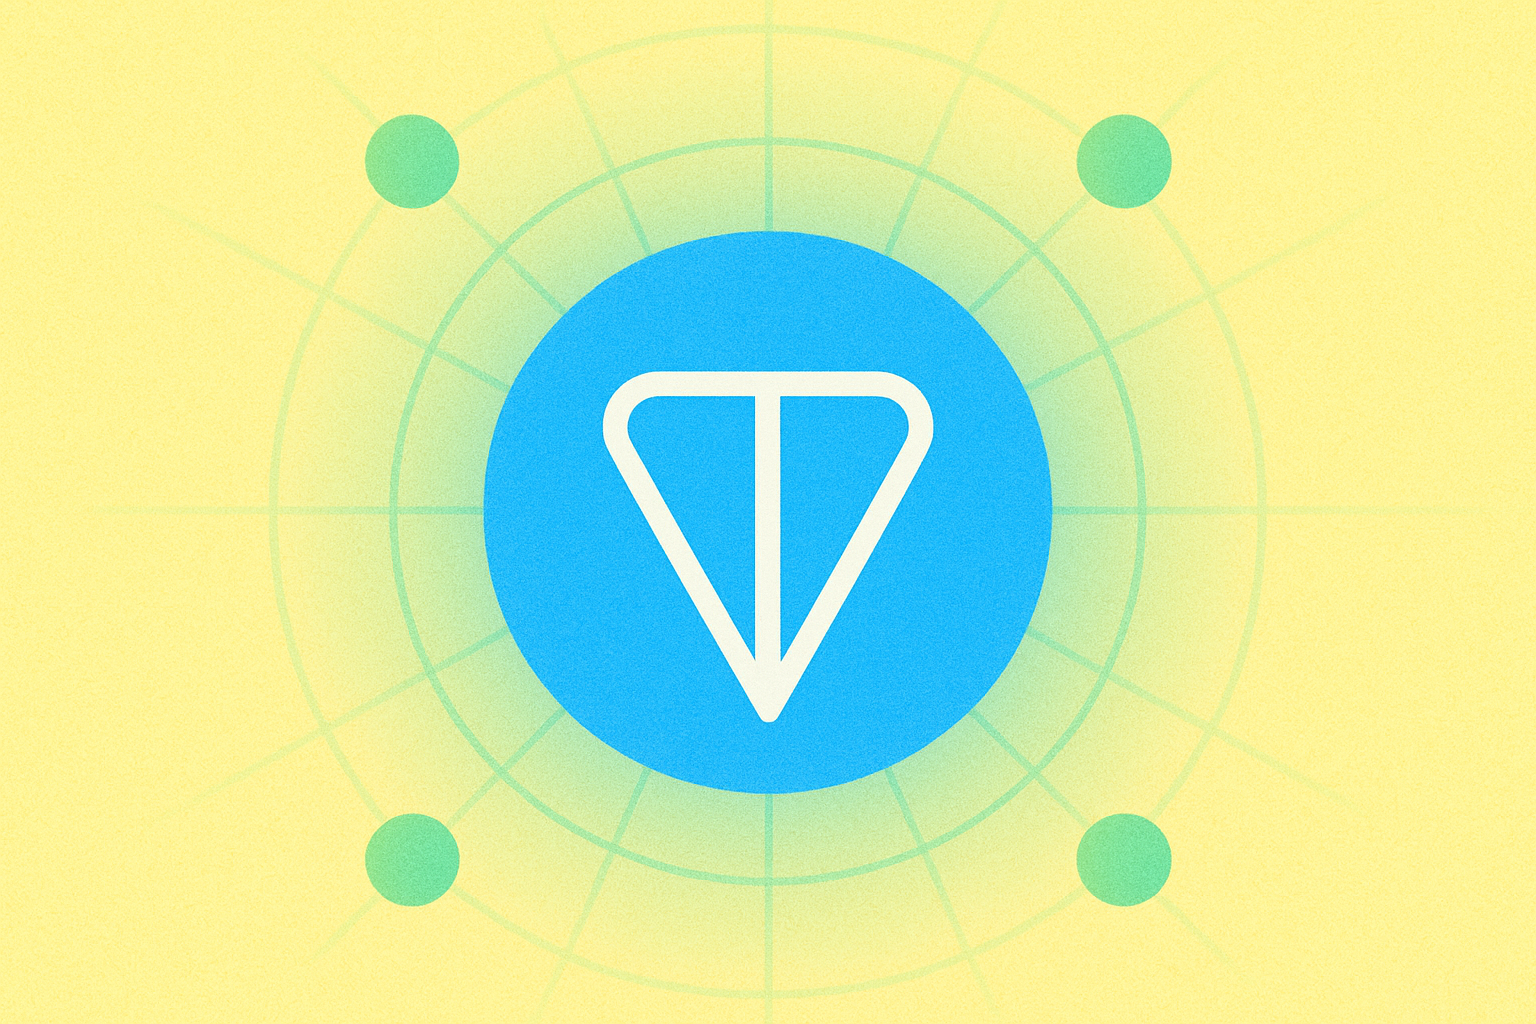
What Is TON Coin? A Comprehensive Guide to Features, Tokenomics, and the Future of The Open Network
Discover The Open Network (TON), a fifth-generation blockchain that delivers millions of transactions per second, ultra-low fees, and seamless integration with Telegram. Explore infinite sharding technology, DeFi applications, and investment prospects for the TON token as Web3 adoption accelerates.
2026-01-09 15:11:20

Bonding Curve
Bonding curves are mathematical mechanisms in decentralized finance that automate token pricing through smart contracts, creating dynamic and transparent pricing based on supply and demand. Introduced by Simon de la Rouviere in 2018, bonding curves calculate token prices using polynomial functions where prices increase exponentially with supply, rewarding early adopters while incentivizing later participation. These mechanisms are widely implemented in decentralized exchanges, ICO platforms, and DAOs to enable automated market making, fair token sales, and governance mechanisms without centralized intermediaries. As DeFi evolves, emerging trends include dynamic bonding curves with adjustable parameters, multi-token implementations, and hybrid models integrating with other DeFi primitives. Bonding curves fundamentally transform how projects fundraise and manage liquidity, democratizing access to market mechanisms and enabling innovative tokenomics designs that align token value with network activity.
2026-01-09 15:03:11
The Rise of EVM-Compatible Chains: A Comprehensive Review of the Top 10
Explore the 10 leading EVM-compatible blockchains for developers in 2024. Compare BNB Smart Chain, Polygon, Avalanche, Fantom, and more. This comprehensive guide details the advantages, reduced fees, and fast performance that support seamless migration of your Solidity smart contracts. Select your optimal EVM chain with Gate.
2026-01-09 14:43:54

Unlock Daily Secret Cipher and Claim Your Bonus in Hamster Kombat
This article unveils the mechanics of Web3 gaming rewards through Hamster Kombat's Daily Secret Cipher challenge. Explore how Morse code-based combinations unlock exclusive in-game bonuses, including $HMSTR tokens, coins, and enhancement items. Learn step-by-step methods to find daily ciphers on official channels, decode them within the game, and claim rewards before expiration. Understand the cipher update schedule (daily at 12:00 PM GMT/UTC) and security protocols for incorrect password entries. This guide addresses key player concerns: maximizing earnings through referral systems, preventing reward expiration, and navigating account lockouts. Ideal for crypto gamers seeking to optimize Web3 gaming profits through consistent daily participation and strategic reward accumulation on Gate.
2026-01-09 14:40:10