Gate Wiki
Gate Wiki empowers users with accessible crypto and blockchain knowledge, delivering trusted token research, industry analysis, trend forecasts, and market insights.

Gate Wiki Topics
Topics
Bitcoin
Ethereum
XRP
Tether
Solana
BNB
Doge
ADA
USDC
TRON
Shiba Inu
Toncoin
Memecoins
AI
RWA
Gaming
DePIN
Altcoins
Blockchain
DeFi
GameFi
Metaverse Crypto
NFTs
Trading Fee
P2P Trading
Stablecoin
Crypto Insights
Investing In Crypto
Crypto staking
Spot Trading
Web 3.0
Crypto Trading
New Cryptocurrencies
Crypto Tutorial
Trading Bots
BRC-20
DAO
Macro Trends
SocialFi
Liquid Staking
Zero-Knowledge Proof
Airdrop
Crypto Ecosystem
Layer 2
Payments
Mining
How to buy crypto
Web3 wallet
Crypto glossary
ETF
Futures Trading
Crypto Loans
Crypto Deposit
Crypto Withdrawal
Bitcoin Halving
Cryptocurrency market
Grid Bot
Inscriptions
K-line
Telegram Mini App
P2E
Cosmos
PoW
CTA
Top crypto
Pre-Market
Price Prediction
Pi Network
Is Crypto Legal in Slovakia?
This comprehensive guide navigates cryptocurrency licensing requirements in Slovakia, providing essential insights for investors, traders, and businesses. Slovakia recognizes cryptocurrencies as legal digital assets and has implemented a balanced regulatory framework aligned with EU directives, particularly the Fifth Anti-Money Laundering Directive. The country requires cryptocurrency exchanges and wallet providers to register with the Slovak Financial Administration and comply with rigorous AML/CFT standards, Know Your Customer procedures, and transaction monitoring. The legal clarity has catalyzed significant adoption, with approximately 12% of the population owning cryptocurrencies and trading volumes surging 30% recently. Local cryptocurrency platforms like Gate offer secure, compliant trading environments with localized support and competitive features. Key considerations include tax obligations on crypto profits, regulatory compliance requirements, and business opportunities in payment solutions and blo
2026-01-09 10:23:54
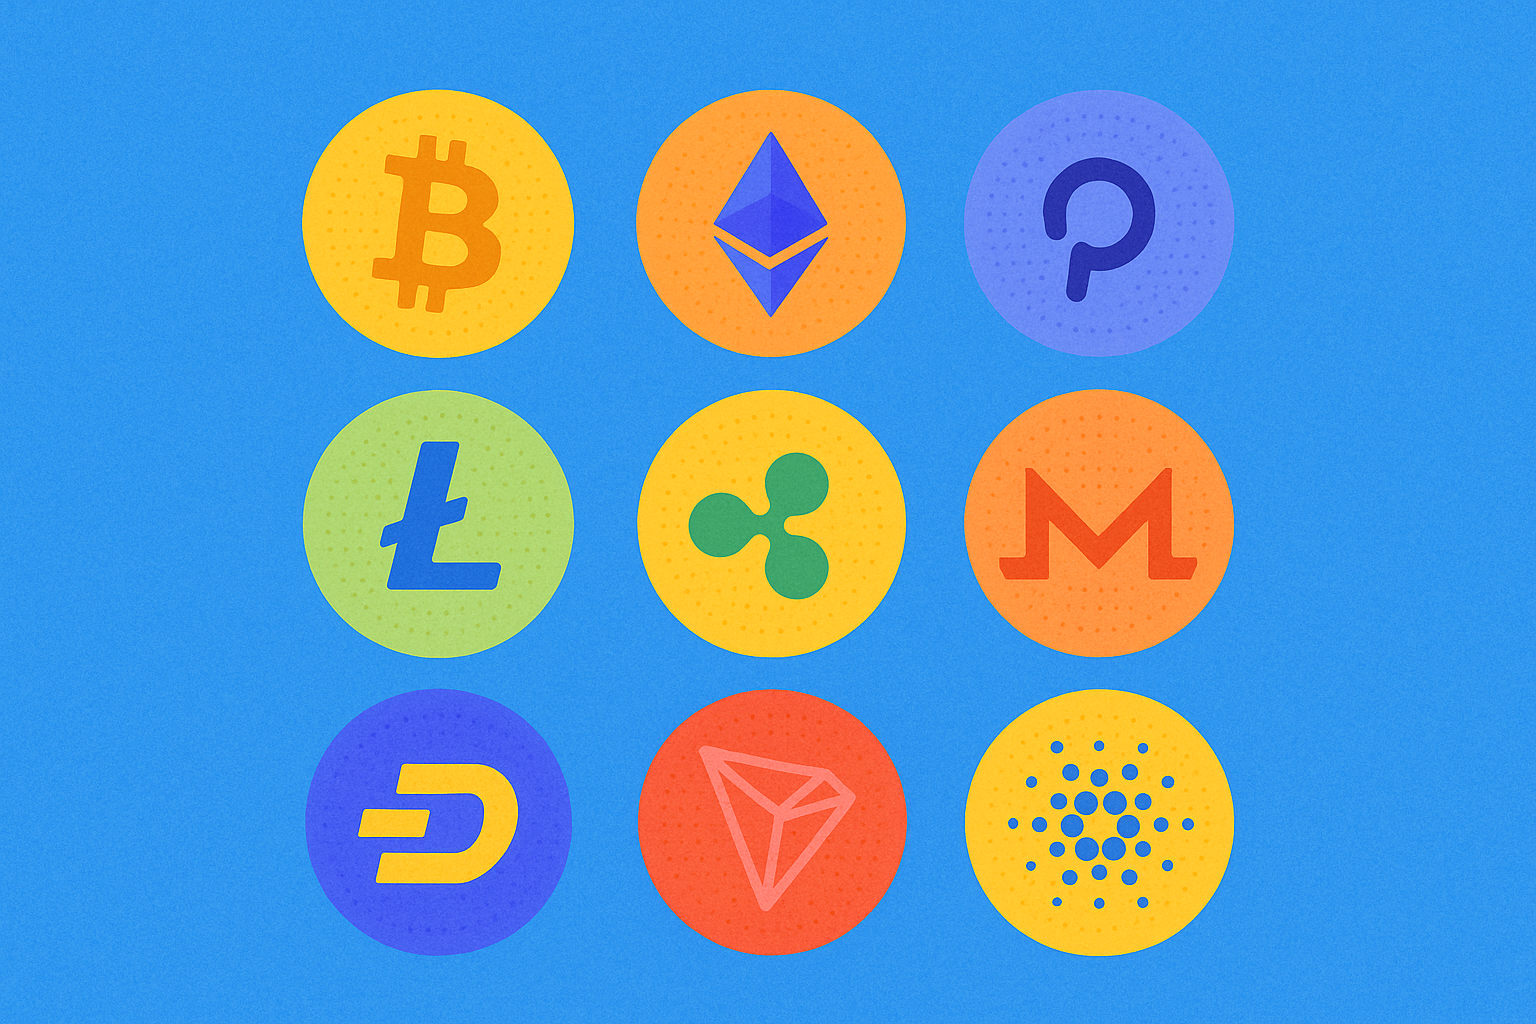
Types of Cryptocurrencies and Their Key Differences
Gain insight into the various types of cryptocurrencies, including Bitcoin, Ethereum, tokens, altcoins, stablecoins, and DeFi. Learn the essential features of each digital asset category designed for novice investors. Trade on Gate with a thorough grasp of the market.
2026-01-09 10:21:59

Daily Cipher Code Guide for Hamster Kombat
Discover the essential guide to mastering the Daily Cipher challenge in Hamster Kombat and unlock 1,000,000 coins daily. This comprehensive article covers the complete mechanics of the Morse code-based cipher system, detailing precise timing requirements and input techniques. Learn step-by-step instructions for accessing Cipher Mode through the Gate platform, executing accurate sequences, and claiming instant rewards. The article provides a complete Morse code reference chart with practical input patterns for all letters, enabling players to decode any cipher word effortlessly. Understand the strategic importance of consistent daily participation and how this daily bonus compounds into significant competitive advantages over time. Whether you're a newcomer or experienced player, this guide ensures successful cipher completion and optimal progression in your virtual exchange building journey.
2026-01-09 09:56:01
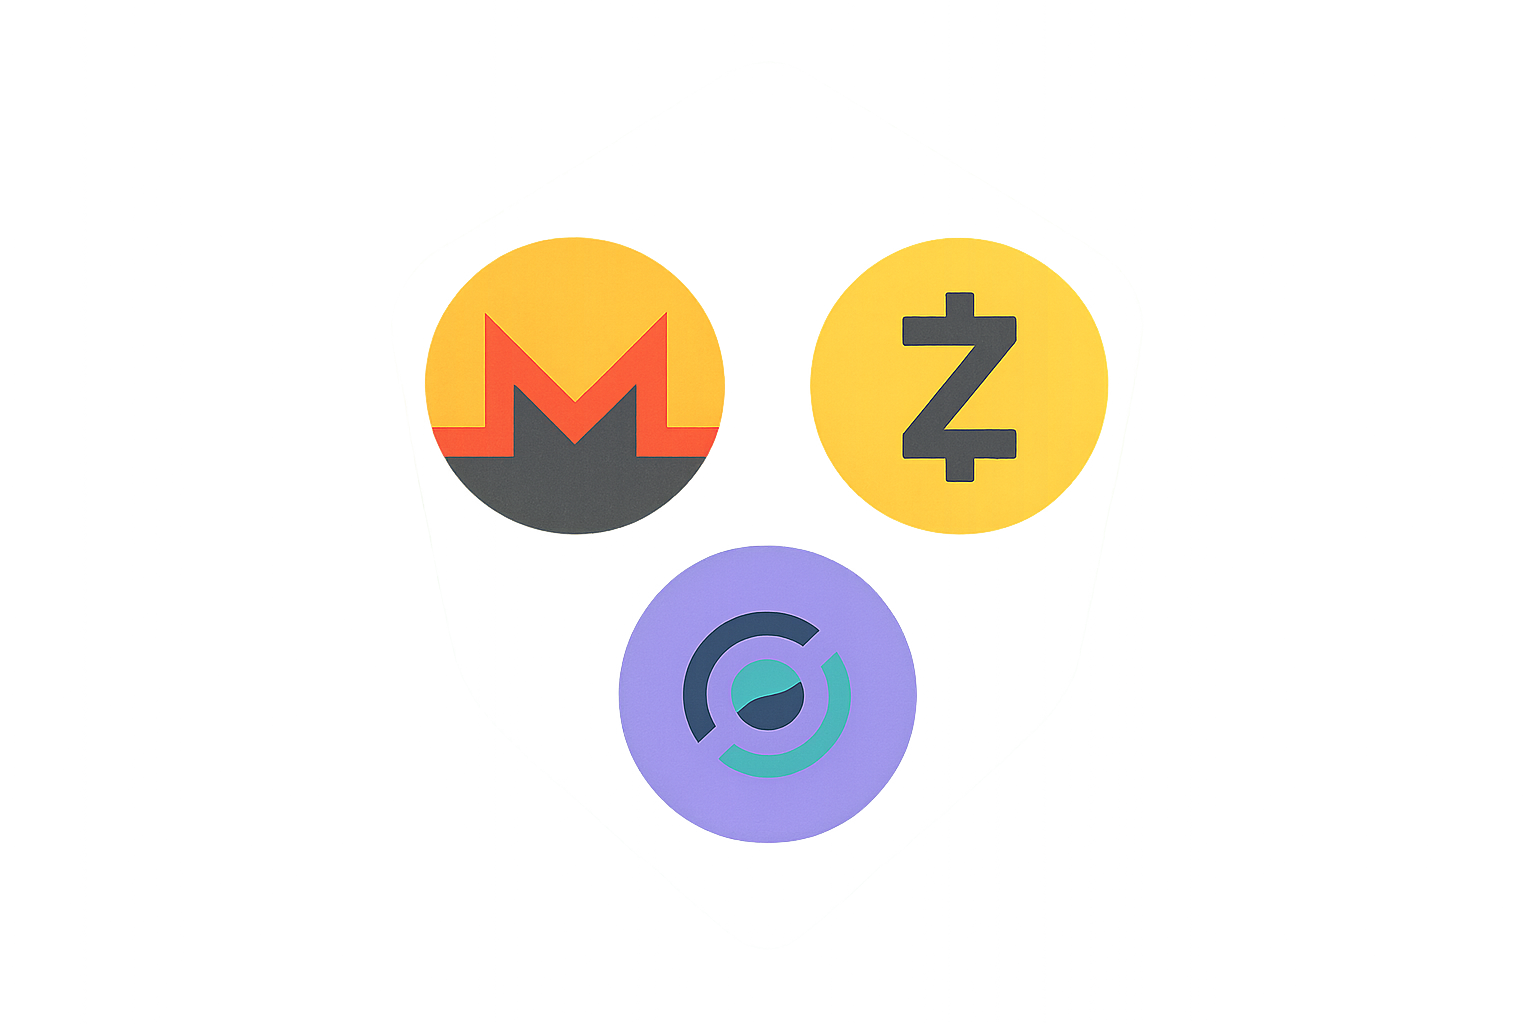
What Are Privacy Coins?
Privacy coins are advanced cryptocurrencies that prioritize user anonymity and data protection through sophisticated cryptographic techniques like ring signatures and zero-knowledge proofs. This article explores how privacy-focused digital currencies such as Monero, Zcash, and Horizen address growing surveillance concerns while offering investors portfolio diversification and users financial confidentiality. Discover the technical implementations behind these privacy-preserving technologies, their practical applications across businesses, humanitarian efforts, and regions with capital controls. The guide analyzes market performance trends showing sustained growth in trading volumes and market capitalization, while addressing regulatory considerations across different jurisdictions. Ideal for investors, traders, and users seeking to understand how privacy coins protect financial sovereignty and maintain transaction confidentiality in an increasingly digital economy.
2026-01-09 09:30:31

Which Coin Owned by Elon Musk
This article examines Elon Musk's cryptocurrency portfolio and his profound influence on digital asset markets. While Musk doesn't own specific cryptocurrency projects, his involvement centers on holding Bitcoin, Ethereum, and Dogecoin, alongside his role as a powerful market catalyst. The guide explores how his social media statements trigger significant price movements, sometimes causing 15% or greater fluctuations within 24 hours. It analyzes real-world applications including Tesla's Bitcoin adoption, Dogecoin's expanded retail acceptance, and corporate treasury strategies influenced by his endorsements. The article presents market data demonstrating his disproportionate impact compared to other business leaders, discusses environmental sustainability dialogues he sparked, and addresses key FAQs about his holdings. Designed for investors and traders seeking to understand celebrity influence dynamics and practical cryptocurrency adoption trends, this comprehensive overview provides actionable insights into
2026-01-09 09:28:15
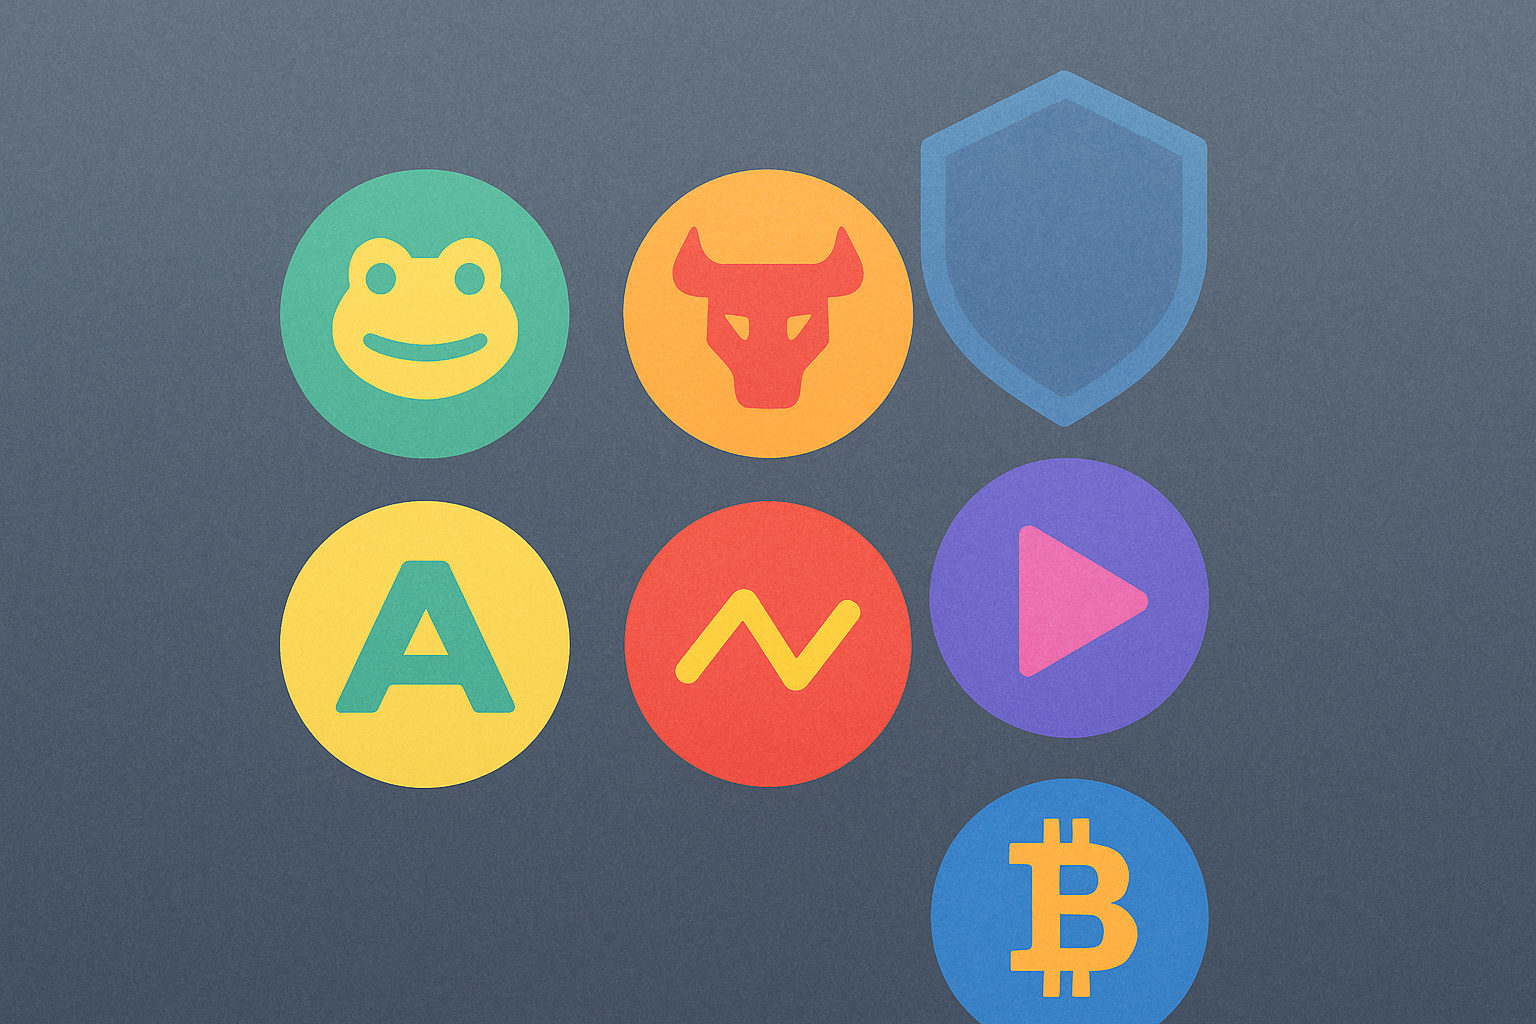
Explore Top Crypto Presales Post-Market Crash
This article explores cryptocurrency presale opportunities amid current market volatility following recent corrections. It examines why presales present attractive entry points for investors seeking discounted token prices and exclusive benefits during market downturns. AlphaPepe emerges as a standout presale project on Gate exchange, offering instant token delivery, staking rewards, and robust security audits that differentiate it from competitors. The article compares AlphaPepe with other notable presales including BullZilla, LivLive, OzakAI, Based Eggsman, and Bitcoin Hyper, highlighting their distinct features and market positioning. The guide emphasizes conducting thorough due diligence, assessing tokenomics and team credentials, and understanding presale mechanisms including token vesting schedules. While presale investments carry inherent cryptocurrency market risks, projects prioritizing transparency and community engagement offer more favorable risk-reward profiles for informed investors navigating t
2026-01-09 09:02:13

What is Football.Fun? A Web-Based Football Management Game Focused on Real-World Matches
Football.Fun revolutionizes fantasy football through fractional player ownership on Web3, enabling users to buy, trade, and hold shares of real players instead of full NFTs. The platform features dual-mode gameplay—Free Mode for casual players and Pro Mode linked to USDC—supported by three integrated currencies: Gold, Tournament Points, and Skill Points. Built on automated market maker (AMM) technology, Football.Fun incorporates advanced risk management including anti-dumping taxes, dynamic fees, and slippage control to prevent market manipulation. Users collect fractional player shares through card packs, build competitive lineups, and earn rewards based on real-world match performance across the Premier League, La Liga, Serie A, Bundesliga, and Ligue 1. The platform combines strategic team management with blockchain asset trading, bridging traditional fantasy football with GameFi mechanics on Gate's infrastructure.
2026-01-09 08:19:43
Daily Hamster Kombat Cipher Code Guide
This comprehensive guide unlocks the daily cipher challenge system in Hamster Kombat, enabling players to maximize coin rewards and gameplay progression. The article addresses key questions for both beginners and experienced players: locating the cipher code through the 'Earn per tap' function, decoding 24-hour puzzle messages, and claiming 1 million daily coins. Each cipher updates every 24 hours, requiring accurate input to avoid penalties and cooldown restrictions. Players learn step-by-step cipher entry procedures, reward mechanics, and strategies for avoiding common mistakes. Perfect for Hamster Kombat enthusiasts seeking to optimize their daily earning potential and accelerate wealth accumulation for upcoming token distributions on Gate.
2026-01-09 08:16:36

Daily Hamster Kombat Cipher Code
Unlock the daily Hamster Kombat cipher and earn a 1 million coin bonus! This complete guide covers Morse code decryption, beginner strategies, and tips for earning $HMSTR tokens in the Web3 game. Updates post daily at 3:00 AM UTC.
2026-01-09 08:12:56
Best Crypto Casino: Top 5 Bitcoin Casinos Reviewed
This comprehensive guide explores the top-rated Bitcoin casinos operating in Finland for 2023, featuring five leading platforms: Stake, BC.Game, BitStarz, Bets.io, and Metawin. Each platform is evaluated across critical dimensions including supported cryptocurrencies, bonus structures, withdrawal capabilities, customer support, and unique gaming features. Stake distinguishes itself through superior sports betting integration and community engagement, while BC.Game leads with provably fair games and transparent house edge display. BitStarz bridges traditional and crypto gambling with hybrid payment options, Bets.io impresses with 10,000+ games and mobile accessibility, and Metawin pioneers NFT integration for decentralized gaming. The article provides detailed specifications for minimum deposits and withdrawals, supported languages, and platform licensing credentials to help Finnish players select the optimal crypto casino based on their specific gaming preferences and security requirements.
2026-01-09 08:09:34
Jack Dorsey
This comprehensive article traces Jack Dorsey's evolution as a transformative technology leader, from revolutionizing social communication through Twitter to democratizing financial services via Square and Block. The narrative explores how Dorsey's ventures have shaped modern digital ecosystems, impacting over 330 million Twitter users and 36 million Cash App users globally. Key focus areas include his pioneering work in fintech, his passionate advocacy for Bitcoin as a tool for financial inclusion, and his vision for decentralized Web3 platforms. The article examines Dorsey's philosophy of reducing centralized power while empowering individuals through technology. It addresses common questions about his companies' functions, leadership approach, and current Web3 initiatives, offering readers a clear understanding of his influence across social media, payments, and cryptocurrency sectors in today's digital economy.
2026-01-09 08:05:18

Decentralized Science (DeSci): A Simple Guide For Beginners
Decentralized Science (DeSci) harnesses blockchain technology to revolutionize scientific research by democratizing access, funding, and collaboration across global communities. This innovative ecosystem eliminates traditional gatekeepers, enabling researchers from underrepresented regions to participate fully while creating transparent, immutable records of discoveries through blockchain infrastructure. DeSci addresses critical challenges in modern academia—including reproducibility crises, paywalled research, and slow peer review processes—by incentivizing reviewers, diversifying funding mechanisms through DAOs, and enabling real-time global collaboration. While facing technical scalability hurdles and regulatory uncertainties, DeSci platforms offer enhanced transparency, intellectual property protection, and accelerated knowledge dissemination. As blockchain technology matures and integration with AI advances, DeSci is positioned to transform academia into a more inclusive, efficient, and equitable researc
2026-01-09 08:03:39
Fallback Function
What is the fallback function? This in-depth guide thoroughly explains its significance and role. It covers core concepts of the fallback function in smart contract development, implementation strategies on Ethereum, real-world use cases, and its importance within the blockchain ecosystem. Tailored for Web3 developers and those learning about smart contracts, the guide also addresses security risk management.
2026-01-09 07:59:19
Cryptocurrency Fear and Greed Index: Definition, Mechanism, and Online Access
Discover how to leverage the Crypto Fear and Greed Index for effective trading. This comprehensive analysis covers how the index is calculated, strategies for buying and selling, where to access data on Gate and other platforms, and essential tips for cryptocurrency traders and investors.
2026-01-09 07:45:08