Gate Wiki
Gate Wiki empowers users with accessible crypto and blockchain knowledge, delivering trusted token research, industry analysis, trend forecasts, and market insights.

Gate Wiki Topics
Topics
Bitcoin
Ethereum
XRP
Tether
Solana
BNB
Doge
ADA
USDC
TRON
Shiba Inu
Toncoin
Memecoins
AI
RWA
Gaming
DePIN
Altcoins
Blockchain
DeFi
GameFi
Metaverse Crypto
NFTs
Trading Fee
P2P Trading
Stablecoin
Crypto Insights
Investing In Crypto
Crypto staking
Spot Trading
Web 3.0
Crypto Trading
New Cryptocurrencies
Crypto Tutorial
Trading Bots
BRC-20
DAO
Macro Trends
SocialFi
Liquid Staking
Zero-Knowledge Proof
Airdrop
Crypto Ecosystem
Layer 2
Payments
Mining
How to buy crypto
Web3 wallet
Crypto glossary
ETF
Futures Trading
Crypto Loans
Crypto Deposit
Crypto Withdrawal
Bitcoin Halving
Cryptocurrency market
Grid Bot
Inscriptions
K-line
Telegram Mini App
P2E
Cosmos
PoW
CTA
Top crypto
Pre-Market
Price Prediction
Pi Network

DeFi Liquidity Mining
This comprehensive beginner's guide explores DeFi liquidity mining, a transformative mechanism that emerged when Compound introduced COMP tokens in 2020. Liquidity mining enables users to earn rewards by providing assets to decentralized pools while supporting price stability and governance participation. The guide covers essential use cases including liquidity provision, user engagement, and protocol ownership distribution. It examines market impacts, technological innovations, and diverse investment opportunities accessible to both institutional and individual investors. Recent trends highlight multi-layered reward structures, concentrated liquidity mechanisms, and sustainable tokenomics models. Whether navigating impermanent loss risks, comparing platforms like Compound and Aave, or understanding APY calculations, this guide provides actionable insights for anyone exploring decentralized finance yield opportunities through Gate or other platforms.
2026-01-09 12:50:27
What is GameFi?
This comprehensive guide explores GameFi platforms and play-to-earn gaming mechanics that revolutionize the gaming industry by combining blockchain technology with decentralized finance. GameFi enables players to earn real cryptocurrencies and NFTs while enjoying gaming experiences, transforming entertainment into income opportunities. The article covers how blockchain ensures true asset ownership, examines leading P2E platforms like Axie Infinity, and discusses earning mechanisms through staking, mining, and NFT trading on Gate and other marketplaces. It explores GameFi's application in creating virtual economies with stock markets and financial instruments, its integration with metaverse development, and the practical benefits of decentralized gaming structures. The guide addresses both opportunities—including monthly earnings potential—and challenges such as high entry costs, latency issues, and regulatory uncertainties, providing players with essential knowledge for navigating this emerging ecosystem effe
2026-01-09 12:48:39
Stablecoins Explained: A Comprehensive Beginner’s Guide to How They Work, How to Choose the Right One, and How to Get Started
An in-depth guide to stablecoin types and characteristics. Explore the distinctions between fiat-backed (USDT, USDC), commodity-backed, crypto-backed, and algorithmic stablecoins—including their benefits, drawbacks, and tips for safe selection. The guide also presents practical strategies for beginners entering the space.
2026-01-09 12:32:42
Complete Guide to Pi Network and Pi Coin
This comprehensive guide explores Pi Network, a mobile-first blockchain platform enabling accessible cryptocurrency mining through smartphones without specialized hardware. Founded by Stanford Ph.D. graduates, Pi Network democratizes digital currency participation through its unique Stellar Consensus Protocol and community-based reward system featuring Pioneers, Contributors, Ambassadors, and Node Operators. The article covers Pi Coin's functionality, tokenomics with an 80 billion token community allocation, and step-by-step instructions for selling Pi on major exchanges like Gate. It examines Pi Network's legitimacy through verified founding credentials, progressive development, and mainnet achievement, while addressing security concerns and future ecosystem expansion plans. The guide includes practical FAQ addressing mining requirements, wallet creation, price information, and long-term application prospects for users seeking to understand this emerging cryptocurrency platform.
2026-01-09 12:26:24

Transaction Hash
This comprehensive guide explores blockchain transaction hashes (TXIDs), unique cryptographic identifiers that serve as digital fingerprints for every transaction on blockchain networks. The article explains how SHA-256 and similar hash functions transform transaction data into immutable fixed-length strings, ensuring data integrity and security. You'll discover practical applications including cryptocurrency verification, fund tracking, and dispute resolution across platforms like Gate, while learning how blockchain explorers enable transparent transaction verification. The guide highlights transaction hashes' critical role in preventing fraud, maintaining immutability, and supporting regulatory compliance in crypto exchanges. Ideal for investors, merchants, and users seeking to understand transaction verification, this resource demonstrates why transaction hashes remain fundamental to blockchain security and trustless transactions in the evolving digital economy.
2026-01-09 12:19:05
Is Crypto Haram?
This comprehensive guide explores whether cryptocurrency aligns with Islamic finance principles, addressing a critical question for Muslim investors navigating modern digital assets. The article examines core Islamic concerns—riba (interest), gharar (uncertainty), and maisir (gambling)—while showcasing real-world Shariah-compliant solutions like gold-backed tokens and institutional initiatives. It highlights growing market demand, regulatory frameworks from Islamic financial centers, and scholarly consensus that cryptocurrency's permissibility depends on individual design and operational mechanisms. Through case studies, statistical insights, and expert perspectives, the article demonstrates that blockchain technology itself is not inherently forbidden; rather, proper implementation ensures compliance. Key takeaways emphasize the importance of consulting qualified Islamic scholars and the substantial opportunities for innovation within Shariah-compliant cryptocurrency development on platforms like Gate.
2026-01-09 12:02:58

Derivatives
This comprehensive guide explores cryptocurrency derivatives, essential financial instruments that enable risk management, price discovery, and strategic trading across digital asset markets. The article covers four main derivative types—futures, options, swaps, and forwards—each serving distinct hedging and speculation purposes. Learn how these instruments evolved from ancient trade mechanisms to modern sophisticated trading tools, their critical role in market liquidity and stability, and practical applications across industries. Discover technological advancements including blockchain and smart contracts reshaping derivatives markets on platforms like Gate, alongside emerging opportunities in climate and digital asset derivatives. Whether you're a novice investor seeking risk protection or an experienced trader pursuing advanced strategies, this guide equips you with essential knowledge about derivative mechanics, management practices, and real-world applications in today's dynamic financial landscape.
2026-01-09 11:56:29
What is cryptocurrency? How does cryptocurrency work? The ultimate beginner's guide to digital assets
A Comprehensive Beginner’s Guide to Cryptocurrencies: Understanding Cryptocurrency, Blockchain Fundamentals, Cryptocurrency Types, Pros and Cons, Wallet Security, Ukraine’s Regulatory Landscape, and the Future of Digital Assets. Discover how to invest securely with Gate.
2026-01-09 11:54:18

Take Profit and Stop Loss: Definitions and Their Importance
Discover how to use stop loss and take profit orders to manage risk when trading cryptocurrencies on Gate. This complete guide covers order setup, strategic approaches, and automated execution for new traders.
2026-01-09 11:19:58
What Is Cryptocurrency? An In-Depth Guide to How Virtual Currencies Operate – The Definitive Digital Asset Handbook for Beginners
Essential Guide for Crypto Beginners! Discover everything you need to know about Bitcoin and Ethereum basics, how blockchain works, choosing the right wallet, security best practices, and starting your journey on Gate. Start your Web3 and DeFi investment adventure here.
2026-01-09 11:16:42
Hamster Kombat Daily Combo Cards Guide
This comprehensive guide explores the top strategies for acquiring Hamster Crypto tokens through Hamster Kombat's Daily Combo feature. The article demystifies the innovative Daily Combo mechanics, a Telegram-based gaming system that rewards players with substantial coin bonuses by strategically selecting and upgrading designated cards from marketing and development categories. Readers will discover step-by-step completion processes, from launching the mini-app to claiming rewards on Gate exchange. The guide contextualizes HMSTR token performance within cryptocurrency markets, analyzing Bitcoin stability, Ethereum ecosystem growth, and play-to-earn gaming trends. With daily refreshes offering 5 million coins and complementary cipher rewards, active players can maximize earnings while boosting airdrop eligibility. The accompanying FAQ addresses participation requirements, reward mechanisms, reset timelines, and optimization strategies, making this essential reading for both gaming enthusiasts and cryptocurrency
2026-01-09 11:05:51
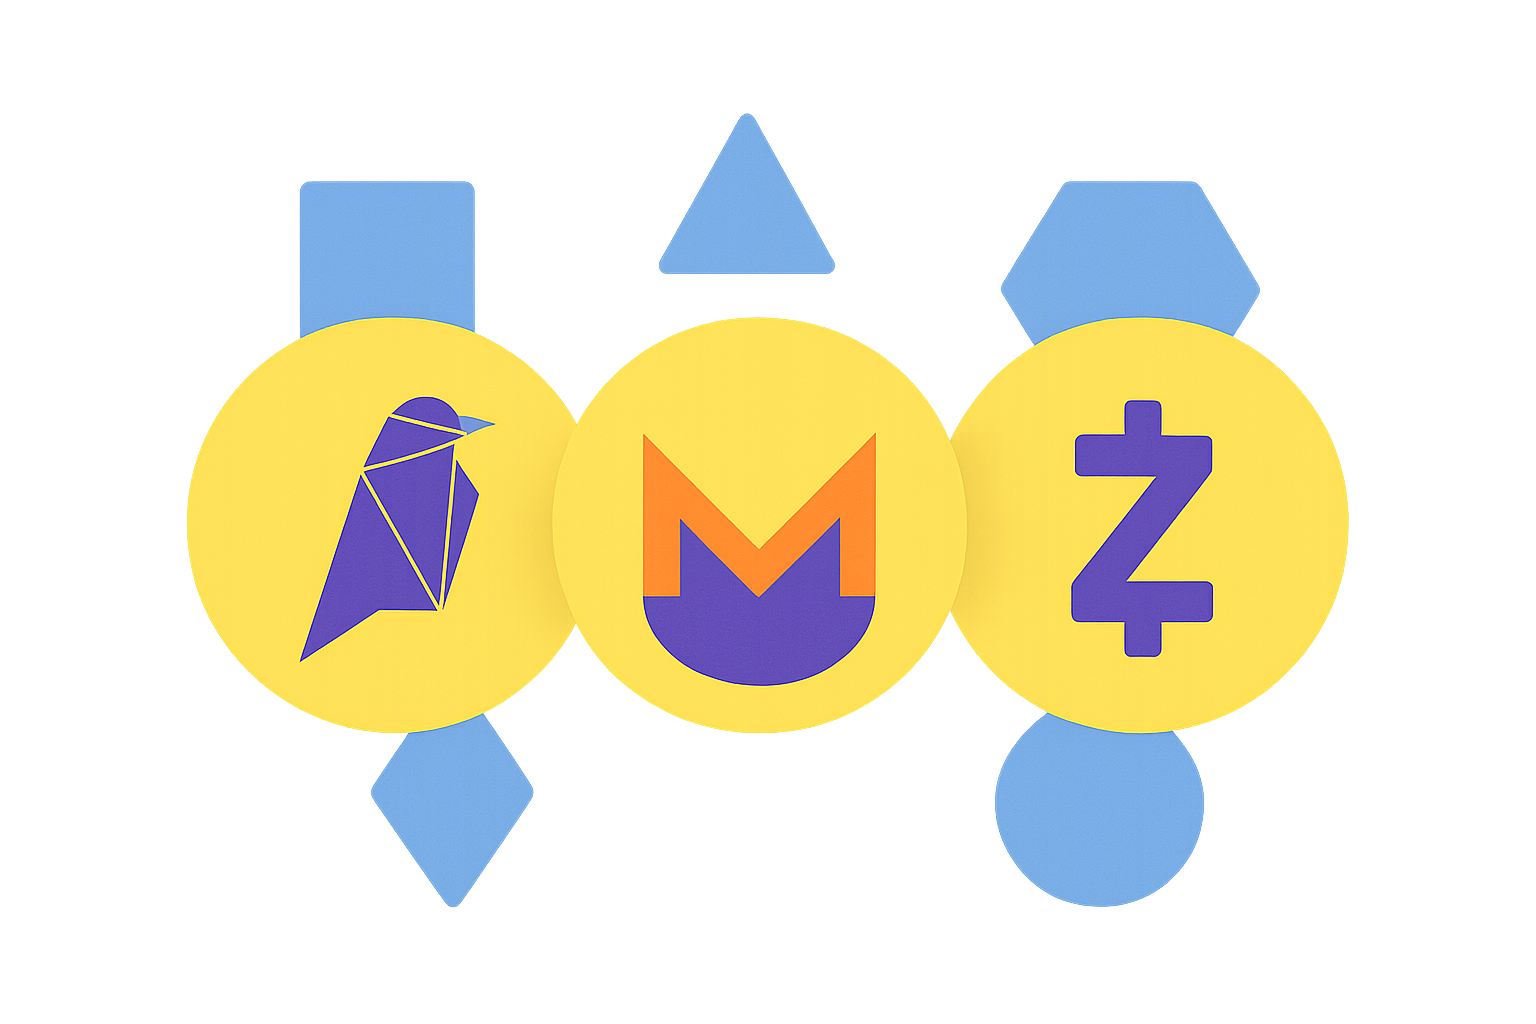
What is the Best Coin to Mine?
This comprehensive guide explores the top cryptocurrencies to mine for maximum profit in 2024, helping miners make informed decisions in a post-Ethereum landscape. The article analyzes critical factors affecting mining success, including hardware capabilities (ASIC, GPU, FPGA), electricity costs, and market dynamics that directly impact returns. Following Ethereum's transition to proof-of-stake, alternatives like Ravencoin, Monero, and Zcash have emerged as leading mining options, each offering unique advantages for different miner types. The guide evaluates network difficulty, hash rates, and liquidity considerations to help readers identify profitable opportunities aligned with their specific goals and operational capabilities. With practical profitability calculators, ROI data ranging from 8-15 months, and strategic risk management insights, miners can optimize operations on Gate and other platforms. Whether seeking immediate returns or long-term value appreciation, this resource provides actionable strate
2026-01-09 10:51:39

Staking
Discover how staking works in the world of cryptocurrencies and how you can earn passive income with Ethereum and other digital assets. Get beginner tips, explore annual yields ranging from 5% to 20%, and stake securely on the Gate platform.
2026-01-09 10:48:23
Crypto Assets (
A comprehensive guide for beginners on the basics of crypto assets (virtual currencies). This resource thoroughly explains major types like Bitcoin and Ethereum, the fundamentals of blockchain technology, key advantages and risks, and step-by-step instructions for trading on Gate. It also provides an extensive outlook on future developments such as Web3 and DeFi.
2026-01-09 10:29:46
Is Crypto Legal in Slovakia?
This comprehensive guide navigates cryptocurrency licensing requirements in Slovakia, providing essential insights for investors, traders, and businesses. Slovakia recognizes cryptocurrencies as legal digital assets and has implemented a balanced regulatory framework aligned with EU directives, particularly the Fifth Anti-Money Laundering Directive. The country requires cryptocurrency exchanges and wallet providers to register with the Slovak Financial Administration and comply with rigorous AML/CFT standards, Know Your Customer procedures, and transaction monitoring. The legal clarity has catalyzed significant adoption, with approximately 12% of the population owning cryptocurrencies and trading volumes surging 30% recently. Local cryptocurrency platforms like Gate offer secure, compliant trading environments with localized support and competitive features. Key considerations include tax obligations on crypto profits, regulatory compliance requirements, and business opportunities in payment solutions and blo
2026-01-09 10:23:54