Gate Wiki
Gate Wiki empowers users with accessible crypto and blockchain knowledge, delivering trusted token research, industry analysis, trend forecasts, and market insights.

Gate Wiki Topics
Topics
Bitcoin
Ethereum
XRP
Tether
Solana
BNB
Doge
ADA
USDC
TRON
Shiba Inu
Toncoin
Memecoins
AI
RWA
Gaming
DePIN
Altcoins
Blockchain
DeFi
GameFi
Metaverse Crypto
NFTs
Trading Fee
P2P Trading
Stablecoin
Crypto Insights
Investing In Crypto
Crypto staking
Spot Trading
Web 3.0
Crypto Trading
New Cryptocurrencies
Crypto Tutorial
Trading Bots
BRC-20
DAO
Macro Trends
SocialFi
Liquid Staking
Zero-Knowledge Proof
Airdrop
Crypto Ecosystem
Layer 2
Payments
Mining
How to buy crypto
Web3 wallet
Crypto glossary
ETF
Futures Trading
Crypto Loans
Crypto Deposit
Crypto Withdrawal
Bitcoin Halving
Cryptocurrency market
Grid Bot
Inscriptions
K-line
Telegram Mini App
P2E
Cosmos
PoW
CTA
Top crypto
Pre-Market
Price Prediction
Pi Network

Hamster Kombat Daily Cipher Code: How to Claim a 1 Million Coin Bonus
Access the Hamster Kombat daily cipher code for November 8, 2025, to unlock 1 million bonus coins. Find out how to enter codes, locate them, and explore exclusive earning strategies. Stay up to date with daily code updates!
2026-01-10 12:57:45
Types of Cryptocurrencies Explained: In-Depth Analysis of Features and Top Picks from Bitcoin to Altcoins
A comprehensive guide for beginners that explains the types and key features of major cryptocurrencies including Bitcoin, Ethereum, and Solana. Learn how to choose altcoins, manage investment risks, and apply essential security practices with clear, straightforward instructions. The guide also provides details on how to buy cryptocurrencies on exchanges such as Gate.
2026-01-10 12:54:29

What is Blockchain?
This comprehensive blockchain guide equips beginners with essential knowledge about the technology transforming digital transactions. Covering blockchain fundamentals, operational mechanisms, and major platforms including Bitcoin, Ethereum, Solana, and others, the article demystifies how decentralized ledgers secure data without intermediaries. It explores real-world applications spanning finance, supply chain, healthcare, and voting systems, while addressing critical challenges like scalability and energy consumption. Readers discover blockchain's distinction from cryptocurrency, examine how smart contracts automate agreements, and learn practical entry points through wallets and blockchain explorers. With emerging solutions improving interoperability and efficiency, blockchain technology continues reshaping digital infrastructure across industries.
2026-01-10 12:45:59

What is OpenSea? Complete Guide to the Leading NFT Marketplace
This comprehensive guide navigates OpenSea, the world's largest NFT marketplace for buying, selling, and creating digital assets across multiple blockchains. Discover OpenSea's history, core features, and practical trading mechanics designed for both beginners and experienced collectors. The article covers multi-blockchain support, user-friendly interface, and free minting tools that democratize digital asset ownership. Learn step-by-step trading instructions, fee structures, and security measures to protect your investments. Explore diverse use cases including digital art, gaming assets, collectibles, and domain names. Compare OpenSea with competitors like Magic Eden and Blur while understanding competitive advantages. This guide equips you with essential knowledge about OpenSea's Seaport protocol, cost optimization strategies, and beginner setup procedures. Whether monetizing creative work, building digital portfolios, or exploring Web3 opportunities, OpenSea provides the infrastructure and tools for secure
2026-01-10 12:41:09

Security Token Offering (STO)
Security Token Offerings (STOs) represent a transformative evolution in blockchain-based capital raising, combining digital asset technology with regulatory compliance to democratize investment opportunities. Unlike their predecessor ICOs, STOs are fully regulated financial instruments backed by tangible assets such as real estate, equity, or bonds, providing enhanced investor protection and market legitimacy. This comprehensive guide explores STOs across multiple dimensions: their emergence as a response to ICO regulatory challenges, diverse applications spanning real estate fractional ownership to entertainment funding, and technological innovations leveraging smart contracts and DeFi protocols. The guide examines evolving regulatory frameworks across progressive jurisdictions and highlights market trends pointing toward greater adoption and cross-border integration. STOs are reshaping capital markets by reducing entry barriers, improving transparency, and enabling 24/7 trading on platforms like Gate, posit
2026-01-10 12:31:08
Emerging Cryptocurrencies: What to Invest in for the Coming Years?
This comprehensive guide explores quality cryptocurrencies positioned for explosive growth, starting with essential evaluation criteria including technology, liquidity, community strength, and growth prospects. The article features a ranked list of ten premium cryptocurrencies—Bitcoin, Ethereum, Solana, Chainlink, Polkadot, Arbitrum, and others—analyzed for market potential and long-term viability. It provides strategic portfolio allocation recommendations for beginners emphasizing stability through major assets like BTC and ETH, while detailing emerging altcoins with 10x potential for experienced investors. Advanced sections cover scam prevention, research methodologies using CoinMarketCap and social signals, and macro trends including AI integration and Layer-2 solutions. The guide equips both novice and seasoned investors with actionable frameworks to identify promising projects on Gate and navigate the dynamic cryptocurrency landscape strategically.
2026-01-10 12:19:55
Rugpull
This comprehensive guide explores rug pulls in cryptocurrency, a critical threat where developers abandon projects and steal investor funds. The article examines the mechanisms behind rugpulls, including tokenomics exploitation, smart contract manipulation, and liquidity pool drainage that have resulted in hundreds of millions in losses. It highlights the erosion of trust in the DeFi ecosystem and regulatory responses to this fraud. The guide details preventive innovations such as on-chain analysis tools, smart contract auditing services, decentralized identity verification, and time-lock mechanisms. Additionally, it provides practical strategies for investors to identify warning signs and assess project legitimacy before investing. By understanding these risks and implementing protective measures, investors can navigate the cryptocurrency landscape more safely and contribute to building a more secure blockchain ecosystem through Gate and other security-conscious platforms.
2026-01-10 12:08:03
Crypto Bubble
This article comprehensively explores the dynamics of cryptocurrency market bubbles, examining their definition, historical evolution, and market implications. It traces the 2017-2018 Bitcoin surge and subsequent crash as a pivotal case study, demonstrating parallels to historical financial bubbles. The article analyzes how crypto bubbles function as warning mechanisms while driving regulatory evolution and market maturation. It covers emerging trends including stablecoins, DeFi platforms, and institutional adoption on Gate, highlighting blockchain technology's underlying value beyond speculation. The guide equips investors with strategies for identifying bubble indicators, managing risks through diversification, and making informed decisions. It emphasizes that despite volatility inherent in early-stage markets, disciplined approaches focusing on fundamentals and long-term value creation enable investors to navigate cryptocurrency markets successfully while capitalizing on transformative blockchain potential
2026-01-10 11:49:58
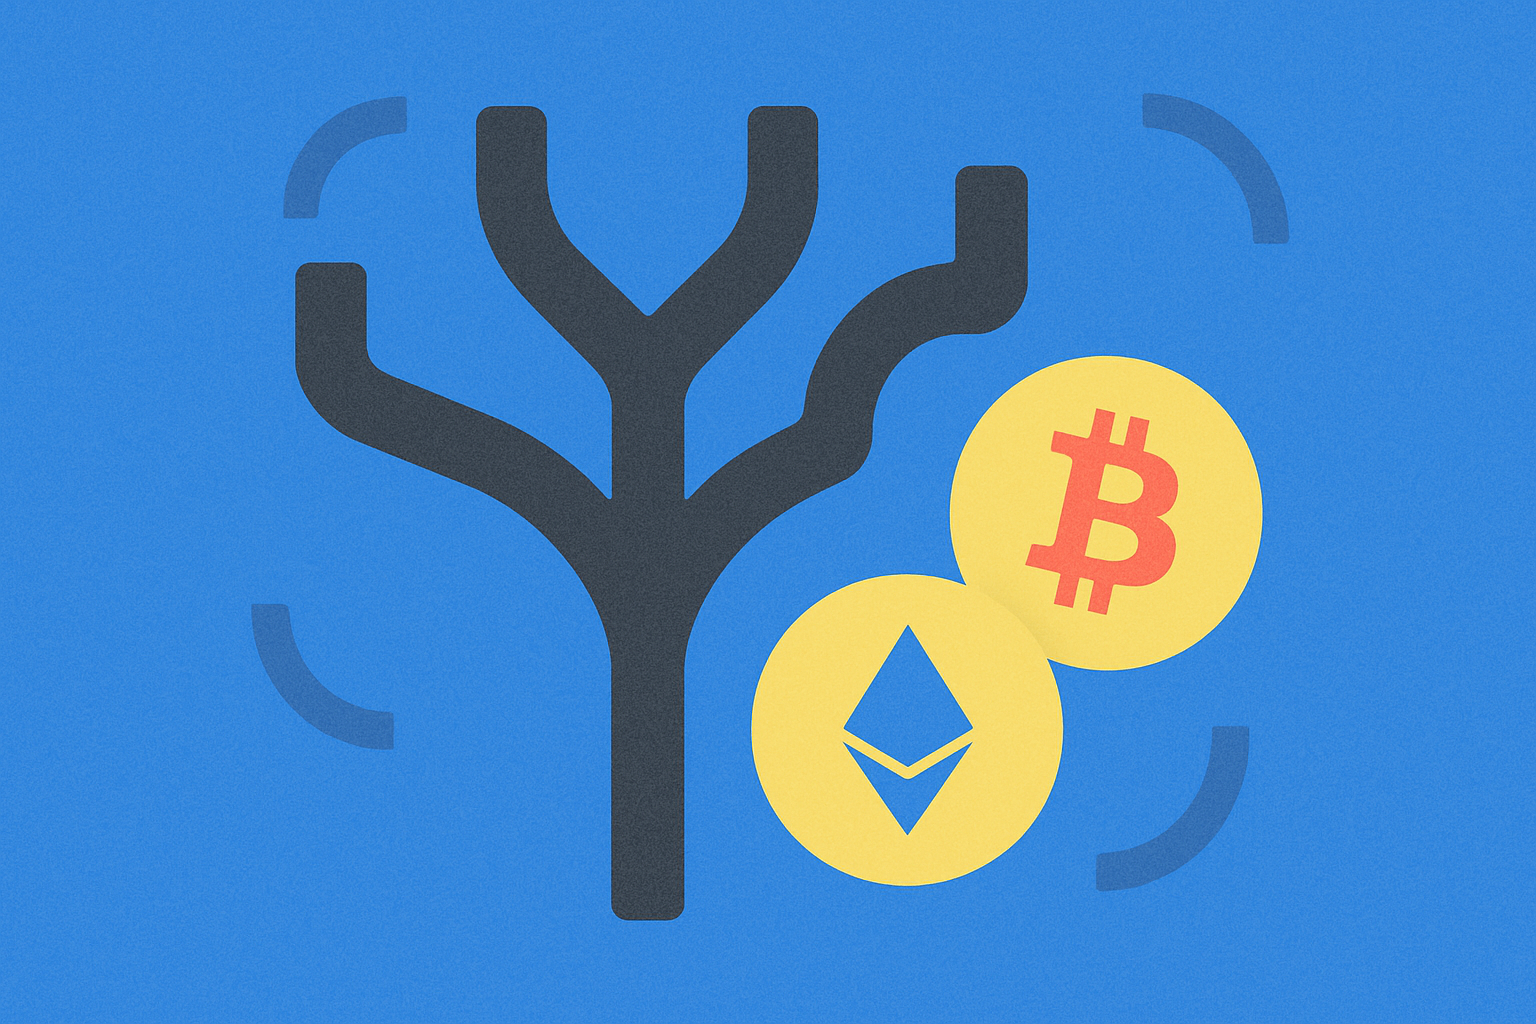
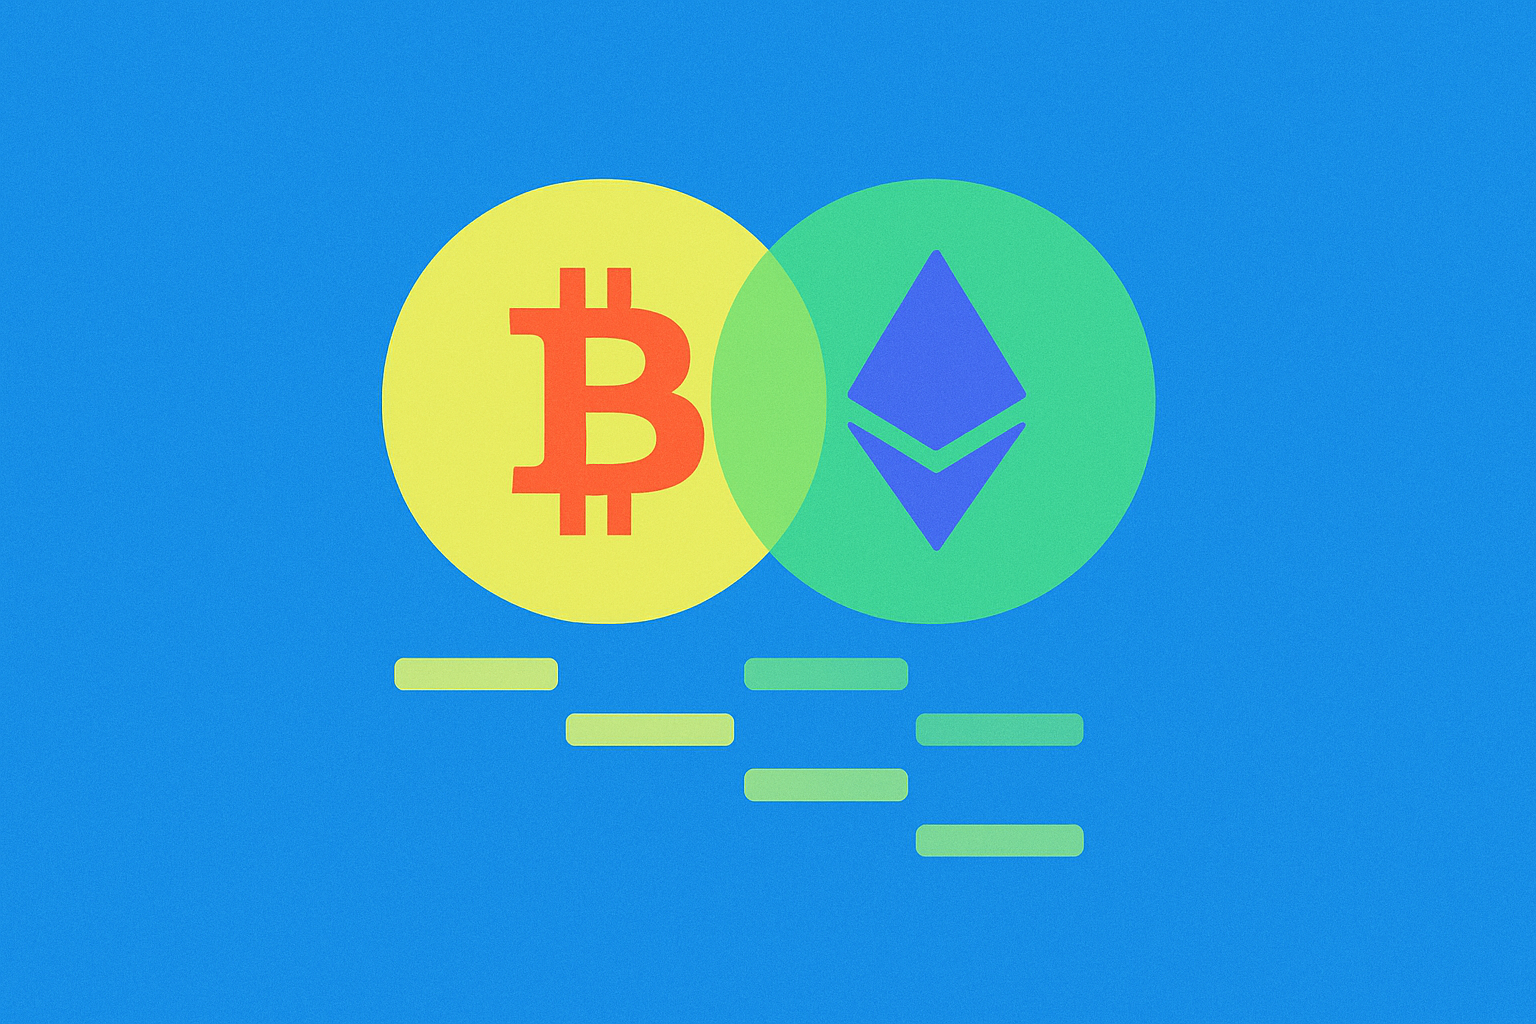
Fork Explained in Plain Language for Git, Cryptocurrency, Apps, and Beyond
Discover what “fork” means in both GitHub and the cryptocurrency world. Find out how forks differ from clones, follow a step-by-step process to create a fork, and explore real-world blockchain applications. This comprehensive guide is designed for both beginners and developers.
2026-01-10 11:31:29
What is Scalping in Trading and How to Start Trading
This comprehensive beginner's guide explores scalping trading strategies across cryptocurrency, forex, and stock markets. Scalping involves executing numerous short-term transactions to capture small profits from price movements, offering quick returns with minimal initial investment ($50-$100). The article outlines core advantages including flexibility, accessibility, and reduced news impact, while addressing risks such as high intensity and transaction costs. Readers learn essential strategies including support/resistance level trading, news-based trading, and trend-based scalping, alongside crucial technical indicators like EMA, RSI, and Bollinger Bands. The guide provides step-by-step setup instructions for trading platforms, including Gate exchange featuring low fees below 0.1% and high liquidity in major pairs like BTC/USDT and ETH/USDT. Critical sections cover risk management techniques, position sizing, emotional discipline, and optimal trading timeframes (M1-M5). Whether using manual analysis or auto
2026-01-10 11:15:05

Forced liquidation of contracts
What is forced liquidation? This guide provides a clear overview of how it works and its effects. Explore the liquidation price calculation formula, risk limits, and margin management, illustrated with specific examples from Gate. Whether you're new to leveraged trading or have intermediate experience, you'll learn essential risk management strategies to prevent forced liquidation.
2026-01-10 11:11:19
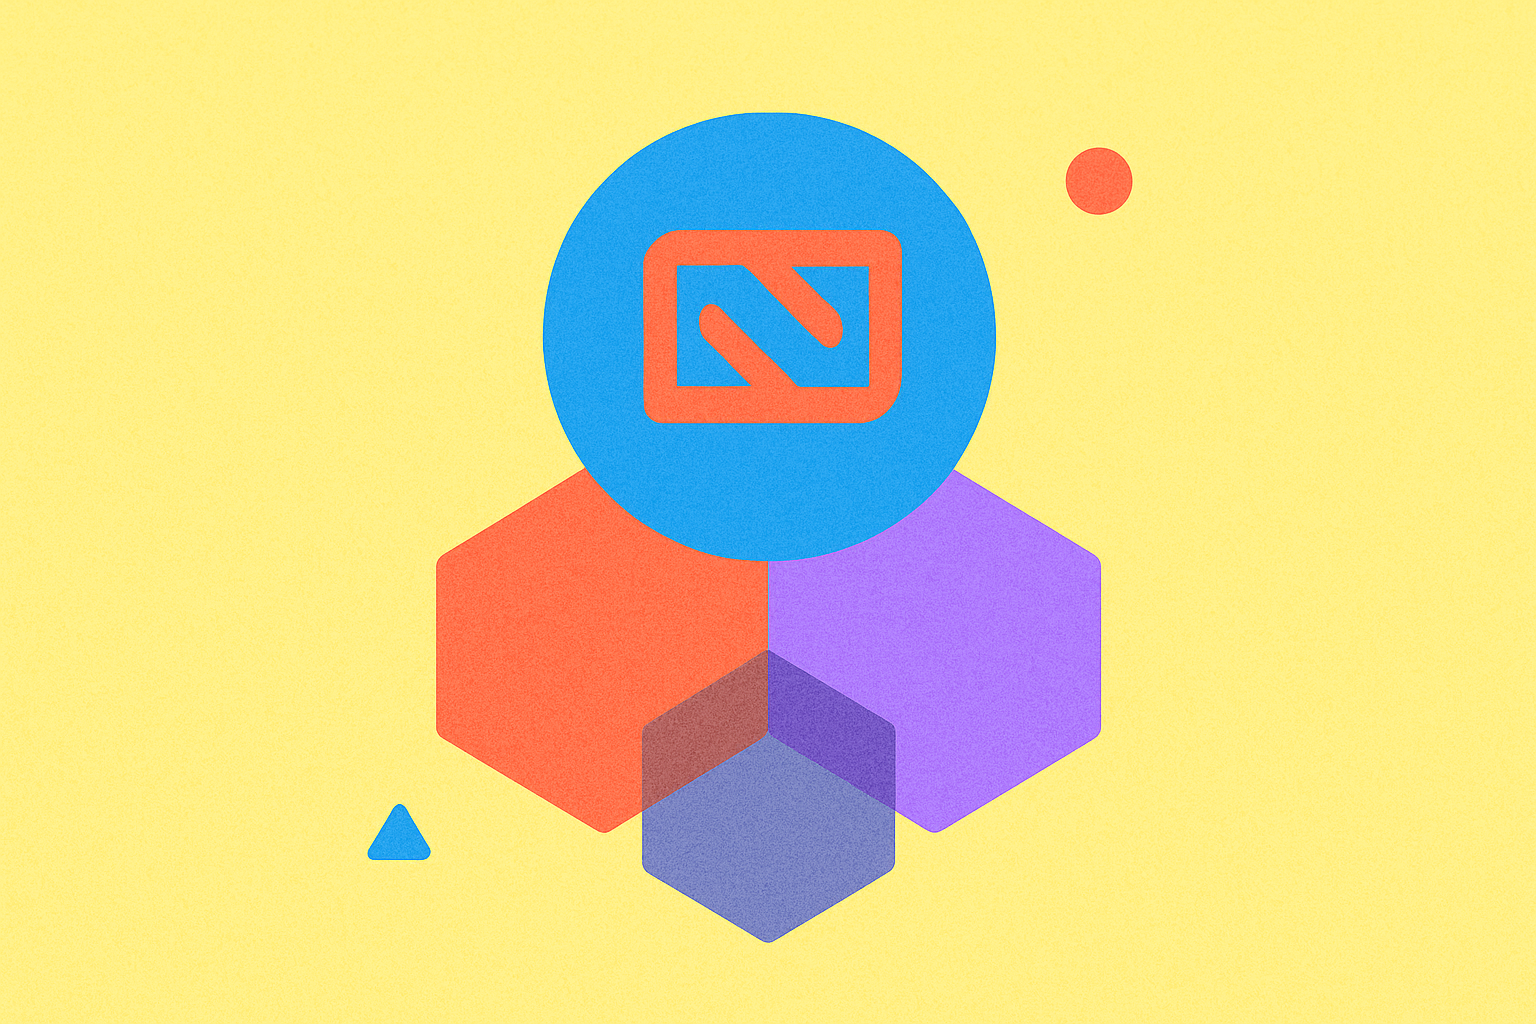
What is Newton Protocol (NEWT)? The first complete guide to the crypto industry's first verifiable automation layer
The complete guide to the Newton Protocol offers an in-depth look at verifiable automation. It covers the functions of the NEWT token, technical details of TEE and ZKP, the zkPermissions permission system, DeFi use cases, and an investment overview. Discover how to buy NEWT tokens on Gate and take advantage of new investment opportunities in the rapidly evolving Web3 infrastructure sector.
2026-01-10 11:05:56
Are There Any Taxes for Crypto in Portugal?
This comprehensive guide explores Portugal's cryptocurrency tax framework, positioning the country as Europe's most crypto-friendly jurisdiction. Individual investors benefit from tax-exempted capital gains on cryptocurrency sales, while professional traders and crypto businesses face standard income tax and VAT obligations. The article clarifies the critical distinction between individual investment and professional trading activities, provides real-world examples including trading scenarios on platforms like Gate, and outlines practical compliance strategies. Readers will understand Portugal's progressive tax rates, VAT implications, and documentation requirements essential for legal operations. Perfect for crypto investors, traders, and businesses seeking to optimize tax efficiency while maintaining full regulatory compliance in this attractive European destination.
2026-01-10 11:00:44

Liquidation
The Complete Guide to Crypto Liquidation: Learn how forced position liquidation works on Gate, effective strategies to avoid margin liquidation, and risk management techniques in cryptocurrency trading for both traders and investors.
2026-01-10 10:58:52